| JCO Tokai-mura Criticality Accident (30 September 1999) |
| Accident scenario: see ¤JCO-Victims |
|
Reference |
|
Kanda, R., Minamihisamatsu, M. and Hayata, I. (2002): Dynamic analysis of chromosome aberrations in three victims of the Tokai-mura criticality accident. Int. J. Radiat. Biol., 78:857-862. |
| Chromosome aberration analysis |
| [1] G2 PCC rings | |||||||||||||||||||
| Case | Sampling | No. of | Distibution of PCC rings | ||||||||||||||||
| ID | time | cells | 0 | 1 | 2 | 3 | 4 | 5 | 6 | 7 | 8 | 9 | 10 | 11 | 12 | 13 | 14 | 15 | |
| A | 9 h | 100 | 21 | 31 | 30 | 14 | 3 | 1 | |||||||||||
| 23 h | 100 | 23 | 30 | 28 | 14 | 5 | |||||||||||||
| 48 h | 15 | 2 | 7 | 4 | 1 | 1 | |||||||||||||
| B | 9 h | 100 | 52 | 26 | 19 | 1 | 1 | 1 | |||||||||||
| 23 h | 100 | 44 | 41 | 13 | 2 | ||||||||||||||
| 48 h | 100 | 39 | 49 | 9 | 3 | ||||||||||||||
| C | 9 h | 100 | 77 | 22 | 1 | ||||||||||||||
| 23 h | 100 | 80 | 17 | 3 | |||||||||||||||
| 48 h | 100 | 83 | 12 | 4 | 1 | ||||||||||||||
| 3.5 mo | 100 | 85 | 13 | 2 | |||||||||||||||
| 6.5 mo | 200 | 177 | 20 | 3 | |||||||||||||||
| 14 mo | 250 | 231 | 19 | ||||||||||||||||
| [2] Dicentrics (see also JCO-ABC) | |||||||||||||||||||
| Case | Sampling | No. of | Distibution of dicentrics | ||||||||||||||||
| ID | time | cells | 0 | 1 | 2 | 3 | 4 | 5 | 6 | 7 | 8 | 9 | 10 | 11 | 12 | 13 | 14 | 15 | |
| A | 9 h | 50 | 1 | 1 | 1 | 4 | 4 | 7 | 5 | 3 | 10 | 3 | 2 | 6 | 2 | 1 | |||
| 23 h | 20 | 2 | 4 | 3 | 4 | 2 | 2 | 2 | 1 | ||||||||||
| 48 h | 8 | 1 | 2 | 1 | 2 | 1 | 1 | ||||||||||||
| B | 9 h | 75 | 10 | 6 | 26 | 15 | 6 | 7 | 2 | 1 | 2 | ||||||||
| 23 h | 50 | 6 | 6 | 10 | 15 | 10 | 2 | 1 | |||||||||||
| 48 h | 50 | 3 | 5 | 14 | 10 | 7 | 7 | 1 | 3 | ||||||||||
| C | 9 h | 200 | 114 | 66 | 16 | 3 | 1 | ||||||||||||
| 23 h | 200 | 117 | 61 | 17 | 4 | 1 | |||||||||||||
| 48 h | 200 | 114 | 64 | 17 | 4 | 1 | |||||||||||||
| [3] Rings | |||||||||||||||||||
| Case | Sampling | No. of | 2 | ||||||||||||||||
| ID | time | cells | 0 | 6 | 2 | 3 | 4 | 5 | 6 | 7 | 8 | 9 | 10 | 11 | 12 | 13 | 14 | 15 | |
| A | 9 h | 50 | 6 | 7 | 15 | 11 | 7 | 4 | |||||||||||
| 23 h | 20 | 1 | 1 | 8 | 6 | 2 | 2 | ||||||||||||
| 48 h | 8 | 1 | 4 | 3 | |||||||||||||||
| B | 9 h | 75 | 42 | 22 | 10 | 1 | |||||||||||||
| 23 h | 50 | 33 | 10 | 6 | 1 | ||||||||||||||
| 48 h | 50 | 32 | 10 | 7 | 1 | ||||||||||||||
| C | 9 h | 200 | 165 | 28 | 6 | 1 | |||||||||||||
| 23 h | 200 | 172 | 26 | 2 | |||||||||||||||
| 48 h | 200 | 176 | 20 | 4 | |||||||||||||||
| . | |||||||||||||||||||
|
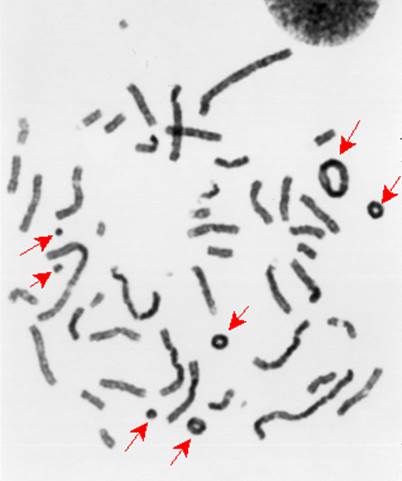
Dose assessment by the use of G2 PCC rings (arrows) 
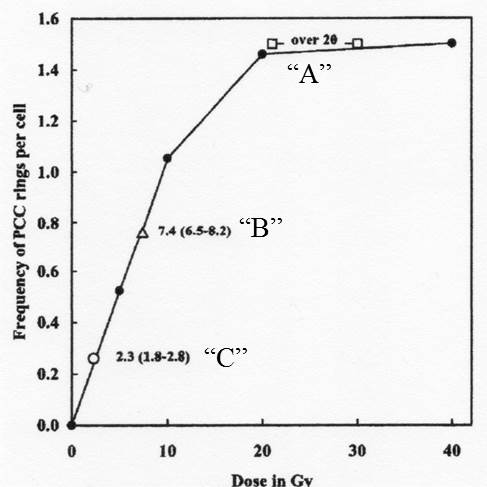
The doses were estimated by direct inferranceof
PCC ring frequencies and the dose response relationship obtained for 200
kVp X-rays. (Photo: by courtesy of Dr. I. Hayata, NIRS). Methodology: see: Suggested empirical formula for calibration: |
|
![]() |