JCO Tokai-mura criticality accident (September 30, 1999)               [1] High Dose Victims

[I] Persons exposed to high-level radiation

Accident scenario
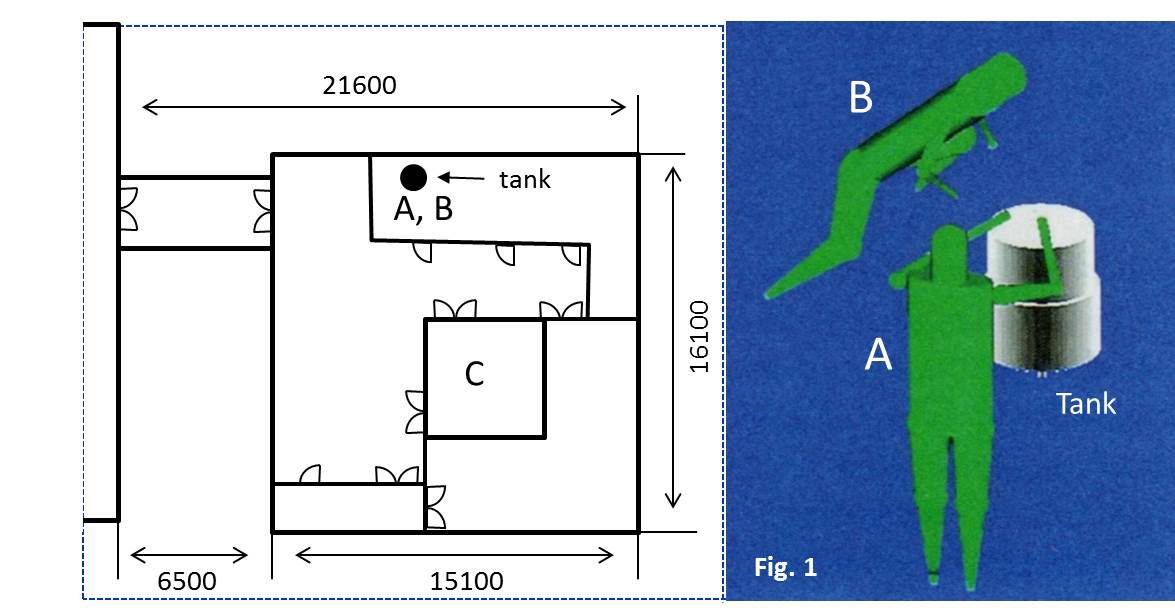
      On September 30, 1999 (10:35 AM), a criticality accident at a uranium conversion facility of JCO Co., Ltd, Tokai-mura, Japan. The criticality accident was triggered by pouring unscheduled amount of 18.8 % enriched uranium solution into precipitation tank, causing prompt criticality reaction. The reaction continued for about 19 hours until the termination at 6:15 AM on 1 October. Simulated position of workers “A” and “B” relative to the precipitation tank is depicted in Figure 1. Worker “C” was at the desk in the next room with wall between them. Immediately after the burst, they escaped to a locker room which was about 25 m away from the tank.  They were all rescued by rescue crews 15 min after accident. During this period, approximately 11 % of all doses were due to the burst in the initial 25 mins.

      Relative positioning of workers (Fig. 1): Ishigure, N., Endo, A., Yamaguchi, Y. and Kawachi, K. (2001): Calculation of the absorbed dose for the overexposed patients at the JCO criticality accident in Tokai-mura. J. Raiat. Res., 42(Suppl):S137-S148.


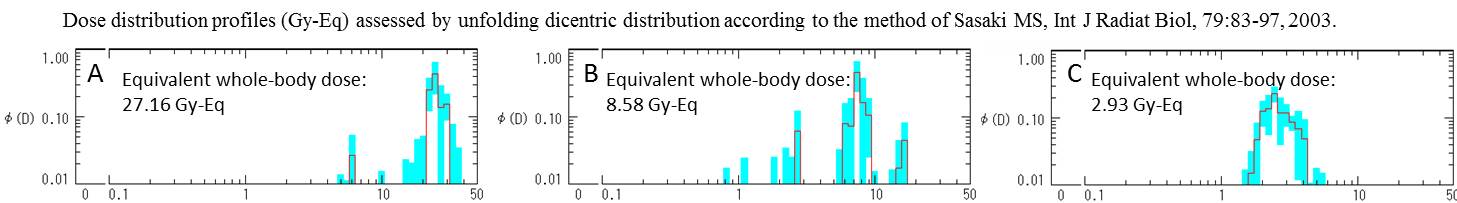
     Chromosome aberration analysis performed by I. Hayata, R. Kanda and M. Minamihisamatsu (National Institute of Radiological Science), M. S. Sasaki (RBC, Kyoto University), andY. Kodama (Radiation Effects Research Founadation),


.
[1] Sevearly exposed workers
Ref: Hayata, I., Kanda, R., Minamihisamatsu, M., Furukawa, A. and Sasaki, M. S. (2000). Chromosome analysis in three patients. In: Tsuji, H. and Akashi, M. eds. Proceedings on
          International Symposium on the Criticality Accident in Tokaimura: Medical Aspects of Radiation Emergency. pp.82-89.
Hayata, I., Kanda, R., Minamihisamatsu, M., Furukawa, A. and Sasaki, M. S. (2001). Cytogenetical dose estimation for 3 severely exposed patients in the JCO criticality
          accident in Tokai-mura. J. Radiat. Res., 42(Suppl): S149-155.
Worker Sampling time No. of Distribution of cells with indicated number of aberrations
after accident cells Aberr 0 1 2 3 4 5 6 7 8 9 10 11 12 13 14 15 16 17 18 19 20
9 hrs 50 Dics 1 1 1 4 4 7 5 3 10 3 2 6 2 1
D+R 1 3 4 6 3 3 6 4 6 6 1 3 2 1 1
"A" (M; 35 yr) 23 hrs 20 Dics 2 4 3 4 2 2 2 1
D+R 1 1 4 3 4 3 3 1
(Deceased 48 hrs 8 Dics 1 2 1 2 1 1
82 days after) D+R 1 1 1 1 1 2 1
Combined 78 Dics 1 1 1 4 7 9 10 6 16 6 4 8 4 1
D+R 1 4 5 8 4 3 11 8 12 9 4 3 4 1 1
Worker Sampling time No. of Distribution of cells with indicated number of aberrations
after accident cells Aberr 0 1 2 3 4 5 6 7 8 9 10 11 12 13 14 15 16 17 18 19 20
9 hrs 75 Dics 10 6 26 15 6 7 2 1 2
D+R 8 3 21 20 8 10 2 1 2
"B" (M; 39 yr) 23 hrs 50 Dics 6 6 10 15 10 2 1
D+R 4 5 9 14 12 4 1 1
(Deceased 48 hrs 50 Dics 3 5 14 10 7 7 1 3
211 days after) D+R 2 5 12 11 7 6 4 2 1
Combined 175 Dics 19 17 50 40 23 16 4 4 2
D+R 14 13 42 45 27 20 7 3 2 2
Worker Sampling time No. of Distribution of cells with indicated number of aberrations
after accident cells Aberr 0 1 2 3 4 5 6 7 8 9 10 11 12 13 14 15 16 17 18 19 20
"C" (M; 54 yr) 9 hrs 100 D+R 52 37 8 2 1
23 hrs 100 D+R 57 27 11 5
48 hrs 100 D+R 52 34 12 2
Combined 300 D+R 161 98 31 9 1
.


.
. Supplementary data (with attention to all chromosome-type aberrations)
Worker No. of Aberrations Distribution of cells with indicated number of aberrations
cells Hex Pnt Tet Tri Dic Rc Ra aM F del S del Aber 0 1 2 3 4 5 6 7 8 9 10 11 12 13 14 15 16 17 18 19 20 21 22 23 24 25 26 27 28 29 30
"A" 56 3 3 10 56 271 80 95 114 620 119 239 221 Dics 1 1 2 7 8 6 9 9 2 6 3 1 1
D+R 1 1 3 2 9 4 8 2 4 6 8 3 3 1 1
Del 4 2 4 5 5 9 4 5 5 2 2 3 2 1 2 1
All 1 1 1 3 3 3 3 3 4 7 3 3 1 3 2 4 3 1 2 3 1 1
"B" 110 0 0 2 13 274 53 38 61 380 53 91 70 Dics 17 16 26 17 12 9 6 2 3 1 1
D+R 15 12 11 24 14 11 6 9 2 2 1 1 1 1
Del 56 24 8 10 7 5
All 12 8 7 16 8 15 8 6 8 7 4 2 4 1 2 1 1
"C" 35 0 0 0 0 29 7 4 1 36 1 8 7 Dics 12 18 4 1
D+R 8 15 11 1
Del 28 6 1
All 6 13 13 2 1
. .