| Cosmonauts/Astronauts: Solid Giemsa dicentrics assay |
Scenario
Cosmic rays are one of the main hazards for long-term manned space missions.
Astronauts/cosmonauts are exposed to various types of high energy charged
particles of the galactic or solar origin. They include electrons, positrons,
protons or heavier ions of high energy. However, the cosmic ray flux around
the space crafts are significantly different from those in free space since
the primary cosmic rays are decelerated by and bombarding the structure
of the space crafts, and hence producing a variety of secondary particles
inside the space crafts. The radiation environment of the astronauts is
thus considerably differs depending on space activity, e.g., missions inside the space craft or extra-vehicle activity. Heavy ion
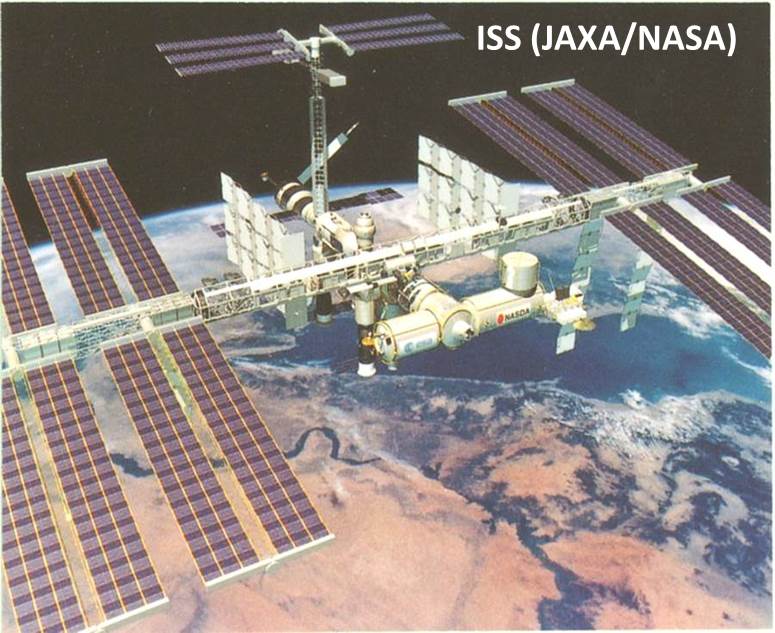
bombardment may produce one-third of the total neutron flux, and in the
International Space Station (ISS; image by Wikipedia 2015), it has been
estimated that approximately 30 % of the dose received by the astronauts
comes from the albedo neutrons and secondary neutrons created by interactions
in the shielding materials. The neutron energies should extend from thermal
energies up to a few GeV. The total radiation environment is thus completely
different from that we can experience, naturally or experimentally, on
the earth. Moreover, the biological response is also complex, for instance,
like photons, neutrons can activate DNA repair pathways (adaptive response)
as well at low doses while high LET charged particles do not. The health
consequences of hits by HZE particles not clear. The health effects associated
with the manned space exploration in the mixed radiation field and their
quantitative evaluation is the major concern in the current space radiobiology.
Chromosome aberration analysis has been carried out in the cosmonauts/astronauts
to meet this requirement. |
 |
| [1] ANTARES and ALTAIR missions: Analysis by solid Giemsa methods, Testard
et al. 1996 |
References
Testard,
I., Ricoult, M., Hoffschir, F., Flury-Herard, A., Dutrillaux, B., Fedorenko,
B., Gerasimenko, V. and Sabatier, L. (1996): Radiation-induced chromosome
damage in astronauts’ lymphocytes. Int. J. Radiat. Biol., 70:403-411.
Chromosome
aberration analysis
Blood
samples were taken from Russian (R) and French (F) astronauts 1-2 months before
and 1 and 7 days after space missions ANTARES (1992) and ALTÏR (1993). Chromosomes
were analyzed by R-banding or Giemsa staining method. The increase in chromosome
damage, as measured by chromosome breaks, was negligible for 2 week mission
(F1) and slight for 3 week mission (F2). However, significant increase of
chromosome damage was found for 6 month missions (R1-R5). Cells with multiple
chromosome aberrations (rogue cells) were observed in post-flight samples of R3
(one in 1000 cells) and R5 (4 in 1100 cells). The cells with 8 or more breaks
were considered as “rogue” cells. The authors assumed that they could be a
consequence of a hit by HZE particle and included in the damage evaluation.
|
Astronaut* |
Duration of |
Blood sampling |
No. of cells |
No. of cells |
Chromosome aberrations |
Distribution of cells with indicated number of breaks*** |
|
|
|
flight |
|
scored |
aberration |
Dics |
cR |
xAce+min |
0 |
1 |
2 |
3 |
4 |
5 |
6 |
7 |
8 |
9 |
10 |
11 |
12 |
13 |
14 |
15 |
16 |
17 |
18 |
19 |
|
|
F1 |
2 w |
after |
657 |
1 |
0 |
1 |
0 |
|
|
|
|
|
|
|
|
|
|
|
|
|
|
|
|
|
|
|
|
|
|
F2 |
3 w |
after |
1,000 |
5 |
2 |
1 |
2 |
|
|
|
|
|
|
|
|
|
|
|
|
|
|
|
|
|
|
|
|
|
|
R1 |
6 mo |
after |
930 |
12 |
4 |
3 |
8 |
918 |
1 |
9 |
1 |
1 |
|
|
|
|
|
|
|
|
|
|
|
|
|
|
|
|
|
R2 |
6 mo |
before |
1,000 |
(5) |
3 |
0 |
2 |
|
|
|
|
|
|
|
|
|
|
|
|
|
|
|
|
|
|
|
|
|
|
after |
1,305 |
16 |
8 |
2 |
6 |
1,289 |
4 |
12 |
|
|
|
|
|
|
|
|
|
|
|
|
|
|
|
|
|
|
|
R3 |
6 mo |
before |
1,001 |
14 |
5 |
2 |
7 |
|
|
|
|
|
|
|
|
|
|
|
|
|
|
|
|
|
|
|
|
|
|
after |
1,000 |
26 |
20 |
5 |
11 |
974 |
4 |
17 |
|
4 |
|
|
|
|
|
|
1 |
|
|
|
|
|
|
|
|
|
|
R4 |
6 mo |
after |
982 |
7 |
3 |
1 |
3 |
975 |
3 |
4 |
|
|
|
|
|
|
|
|
|
|
|
|
|
|
|
|
|
|
|
R5 |
6 mo |
before |
1,000 |
13 |
4 |
1 |
14 |
|
|
|
|
|
|
|
|
|
|
|
|
|
|
|
|
|
|
|
|
|
|
after |
1,100 |
23 |
14 |
3 |
36 |
1,077 |
6 |
12 |
|
1 |
|
|
|
2 |
|
|
|
|
|
1 |
|
|
|
|
1 |
|
|
Controls** |
|
|
60,000 |
3 |
1 |
(3) |
2 |
|
|
|
|
|
|
|
|
|
|
|
|
|
|
|
|
|
|
|
|
|
|
*) F: French astronauts, R: Russian astronauts. Blood samples were taken 1-2 mo before ANTARES and ALTAIR space flights and 1 and 7 days after flights. |
|
|
**) Controls are taken from Lloyd et al., Int. J. Radiat. Biol., 61:335-343, 1992. |
|
|
|
|
|
|
|
|
|
|
|
|
|
|
|
|
|
***) Cells with multiple aberrations (rogue cells) were found in the post-flight samples from R3 and R5. These aberrations were included. The cells exhibiting 8 or more breaks were considered as rouge cells. |
|
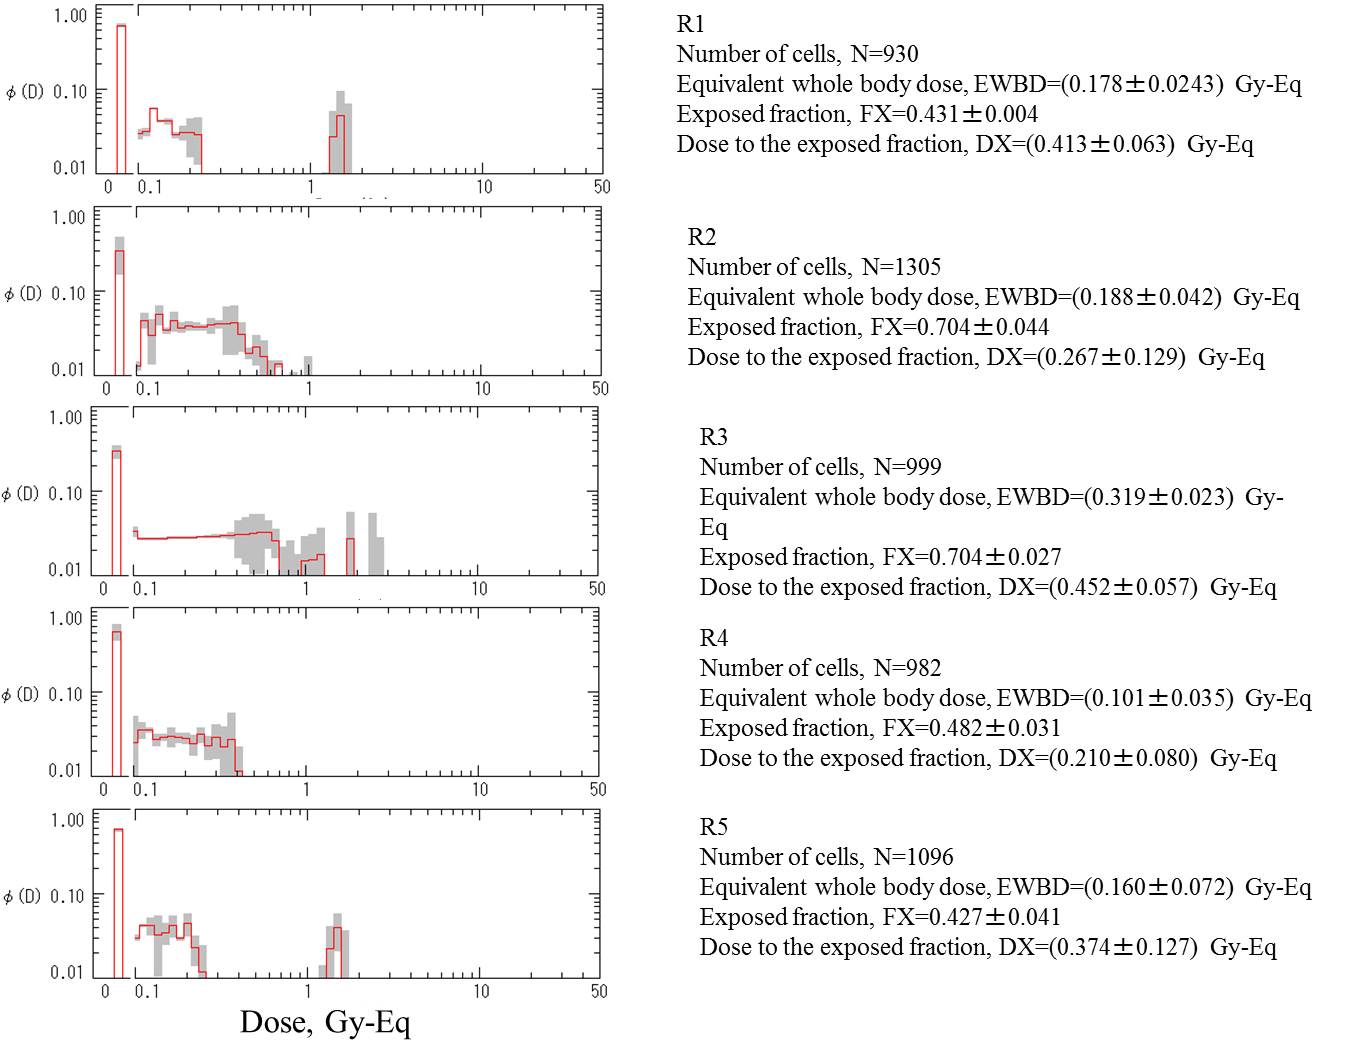
Commentary (Editorial):
As seen in the Table above, the cellular
distribution of damage is given as cells with indicated number of breaks.
The break distribution was converted to the approximate number of two-break
aberrations by A≈int(B/2), in which A is number of two-break aberrations
in a class (n-1) and B is number of breaks in a class (n). Then, the dose
distribution profiles were obtained by unfolding aberration distribution
of virtuailized dicentrics and rings.
| [2] MIR and EUROMIR missions: Analysis by solid Giemsa method, Obe et al.
1997 |
Reference
Obe, G., Johannes, I., Johannes, C., Hallman, K., Reitz, G. and Facius, R. (1997): Chromosomal aberrations in blood lymphocytes of astronauts after long-term space flights. Int. J. Radiat. Biol., 72:727-734.
Chromosome aberration analysis (conventional Giemsa method)
Blood samples were taken from the astronauts
a few days before (BF-samples) and after return from the last space flight
(AF-samples). Chromosome aberrations were analyzed by conventional Giemsa
staining method. Chromosome-type aberrations were significantly elevated
in blood samples taken after flight as compared to those before. Two cells
with multiple aberrations (rogue cells) were observed in post-flight sample
of astronaut A2.
|
Astronaut |
Missio of |
Duration (days) of |
low LET dose (mGy) |
High LET dose (mGy) |
Planar flux of HZE* (cm-2) |
Blood |
No. of |
Damaged |
Chromosome aberrations*** |
Distribution of dicentrics**** |
|
last flight |
earlier flight |
last flight |
total |
earlier flight |
last flight |
earlier flight |
last flight |
earlier flight |
last flight |
sampling** |
cells |
cells (%) |
Dic |
cR |
aR |
xAce |
ctd aberr |
0 |
1 |
2 |
|
A1 |
|
|
|
|
|
|
|
|
|
|
BF |
- |
- |
- |
- |
- |
- |
- |
- |
- |
- |
|
MIR94 |
7+166+146 |
180 |
499 |
93 |
68 |
65 |
4 |
100 |
140 |
AF |
599 |
1.8 |
6 |
0 |
1 |
5 |
0 |
593 |
6 |
|
|
A2 |
|
|
|
|
|
|
|
|
|
|
BF |
1,161 |
1.7 |
4 |
0 |
0 |
13 |
3 |
1,157 |
4 |
|
|
MIR95 |
237+179 |
120 |
536 |
164 |
57 |
11.7 |
4.1 |
375 |
160 |
AF |
2,783 |
2.3 |
14 |
4 |
4 |
49 |
0 |
2,770 |
12 |
1 |
|
A3 |
|
|
|
|
|
|
|
|
|
|
BF |
1,444 |
0.3 |
2 |
0 |
0 |
2 |
1 |
1,442 |
2 |
|
|
MIR95 |
0 |
120 |
120 |
- |
57 |
- |
4.1 |
- |
160 |
AF |
2,786 |
0.6 |
3 |
0 |
3 |
13 |
0 |
2,784 |
1 |
1 |
|
A4 |
|
|
|
|
|
|
|
|
|
|
BF |
4,852 |
0.1 |
2 |
0 |
0 |
5 |
0 |
4,850 |
2 |
|
|
EUROMIR95 |
0 |
179 |
179 |
- |
85 |
- |
6.1 |
- |
240 |
AF |
214 |
0.9 |
1 |
1 |
0 |
0 |
0 |
213 |
1 |
|
|
A5 |
|
|
|
|
|
|
|
|
|
|
BF |
210 |
3.3 |
1 |
0 |
0 |
6 |
0 |
209 |
1 |
|
|
EUROMIR95 |
0 |
179 |
179 |
- |
85 |
- |
6.1 |
- |
240 |
AF |
452 |
7.7 |
5 |
2 |
3 |
29 |
1 |
447 |
5 |
|
|
A6 |
|
|
|
|
|
|
|
|
|
|
BF |
2,156 |
0.5 |
3 |
0 |
0 |
5 |
2 |
2,153 |
3 |
|
|
MIR96 |
0 |
198 |
198 |
- |
94 |
- |
6.7 |
- |
270 |
AF |
1,593 |
1.4 |
11 |
2 |
5 |
6 |
1 |
1,582 |
11 |
|
|
A7 |
|
|
|
|
|
|
|
|
|
|
BF |
1,044 |
1.3 |
2 |
1 |
1 |
4 |
6 |
1,042 |
2 |
|
|
MIR96 |
0 |
198 |
198 |
- |
94 |
- |
6.7 |
- |
270 |
AF |
2,156 |
1.5 |
11 |
2 |
6 |
14 |
0 |
2,145 |
11 |
|
|
Pooled data from A2 to A7 |
|
|
|
|
|
|
|
|
BF |
10,867 |
0.6 |
14 |
1 |
1 |
35 |
12 |
10,853 |
14 |
|
|
|
|
|
|
|
|
|
|
AF |
9,984 |
1.7 |
45 |
11 |
21 |
111 |
2 |
9,935 |
47 |
2 |
|
*) HZE particles of LET&rt;2.0 GeV/cm. The high LET radiation dose
includes the dose due to HZE. |
|
|
|
|
**) BF: before flight, AF: after flight |
|
|
|
|
***) Dic: dicentrics, cR: centric rings, aR: acentric rings, xAce: excess acentrics including double minutes, ctd: pooled total chromatid-type aberrations. |
|
|
Two rogue cells (one cell with 6 dicentrics and another cell with 1 tricentric and 3 dicentrics) found in the after flight sample from astronaut A2 are excluded. |
|
****) Dicentrics distribution data are courtesy of Dr. G. Obe (Department of Genetics, University of GH Essen, Germany). |
|
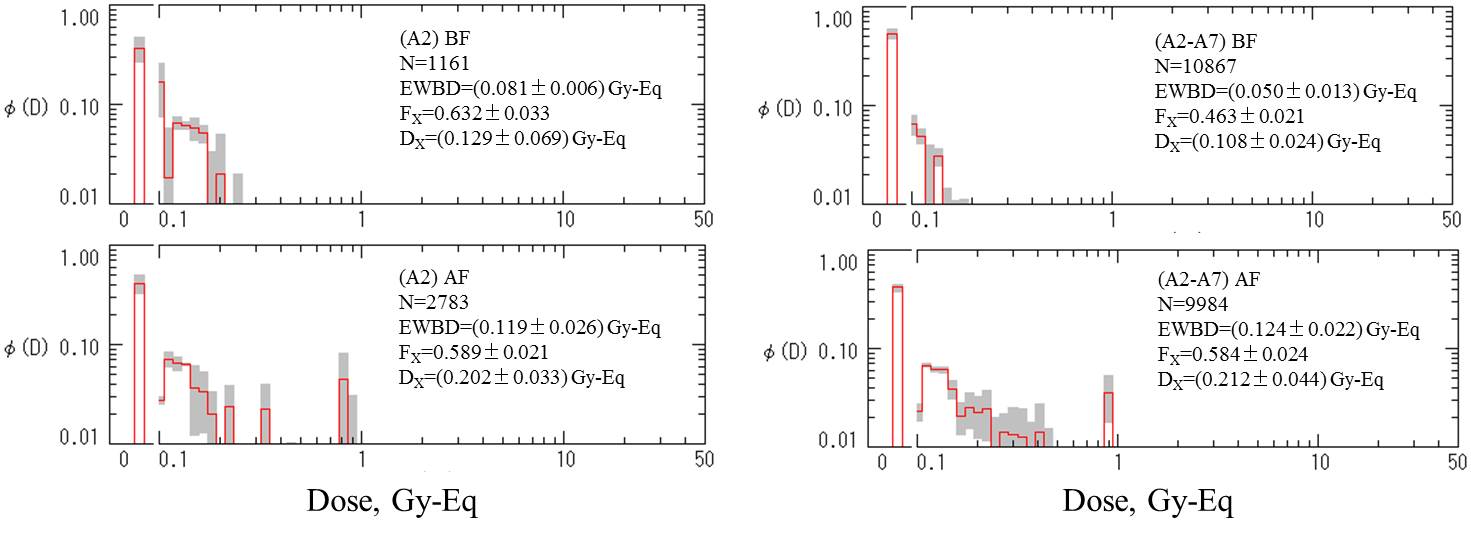
Commentary
(Editorial)
The assessment of dose distribution profiles
by unfolding dicentric distribution in samples taken either before (BF)
or after (AF) flight for the astronaut A2 and astronauts A2-A7 combined.
The distribution of dicentrics (also shown in Table above) is courtesy
of Dr. G. Obe (University of GH Essen, Germany). The ‘rogue’ cells are
not considered in this dose assessment. EWBD=equivalent whole body dose.
Fx=exposed fraction. Dx=dose to the exposed fraction.
|
| [3] MIR missions: Analysis by solid Giemsa method, Fedoreko et al. 2001 |
Reference
Fedorenko, B., Druzhinin, S., Yudaeva, L.,
Petrov, V., Akatov, Yu., Snigiryova, G., Novitskaya, N., Shevchenko, V.
and Rubanovich, A. (2001): Cytogenetic studies of blood lymphocytes from
cosmonauts after long-term space flight on MIR station. Adv. Space Res.,
27:355-359.
Chromosome
aberration analysis
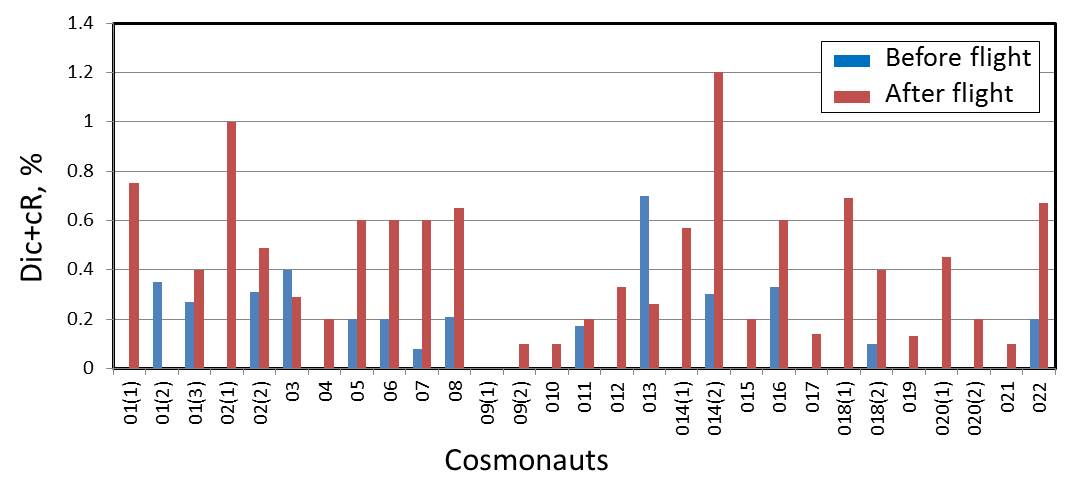
Chromosome aberration analyses were carried
out on a total of 22 cosmonauts 1-2 months before and a day after long-term
space flight on MIR station. Some of the cosmonauts were examined after
repeated flights. The duration of the mission was on average 4-6 months.
Chromosome preparations were stained by Giemsa and chromosome-type aberrations
were scored.
In
most of the cosmonauts, the chromosome aberration frequencies were
significantly higher in the post-flight samples as compared to those in
pre-flight samples, on average approximately 3 times elevation.
|
Cosmonaut, code* |
|
01(1) |
01(2) |
01(3) |
02(1) |
02(2) |
03 |
04 |
05 |
06 |
07 |
08 |
09(1) |
09(2) |
010 |
011 |
012 |
013 |
014(1) |
014(2) |
015 |
016 |
017 |
018(1) |
018(2) |
019 |
020(1) |
020(2) |
021 |
022 |
|
|
No. of cells |
BF*** |
200 |
850 |
1500 |
200 |
1310 |
500 |
550 |
500 |
1500 |
2400 |
1415 |
200 |
500 |
500 |
1200 |
150 |
1001 |
200 |
1000 |
500 |
1500 |
140 |
700 |
1000 |
500 |
200 |
1160 |
874 |
1500 |
|
|
AF |
930 |
536 |
500 |
100 |
612 |
350 |
500 |
500 |
1000 |
1000 |
1387 |
200 |
1000 |
1000 |
1000 |
900 |
760 |
352 |
500 |
1000 |
500 |
700 |
1020 |
1000 |
758 |
220 |
1000 |
1000 |
593 |
|
|
Aberration**, % |
BF |
2.00 |
1.06 |
1.93 |
1.50 |
1.53 |
1.60 |
0.73 |
1.40 |
2.67 |
1.08 |
1.41 |
2.50 |
2.40 |
0.40 |
2.00 |
1.33 |
1.40 |
1.00 |
2.10 |
2.00 |
1.80 |
1.43 |
3.14 |
2.30 |
1.80 |
2.50 |
1.38 |
1.37 |
1.13 |
|
|
AF |
1.61 |
2.99 |
4.00 |
3.00 |
1.14 |
1.71 |
1.60 |
4.00 |
2.20 |
1.30 |
1.66 |
7.00 |
2.20 |
3.00 |
1.70 |
1.44 |
3.42 |
1.42 |
3.60 |
2.40 |
2.20 |
2.71 |
1.08 |
1.90 |
1.85 |
4.09 |
1.40 |
1.00 |
1.52 |
|
|
Cells with Dic+cR, % |
BF |
0.00 |
0.35 |
0.27 |
0.00 |
0.23 |
0.40 |
0.00 |
0.20 |
0.20 |
0.08 |
0.21 |
0.00 |
0.00 |
0.00 |
0.17 |
0.00 |
0.70 |
0.00 |
0.30 |
0.00 |
0.33 |
0.00 |
0.00 |
0.10 |
0.00 |
0.00 |
0.00 |
0.00 |
0.20 |
|
|
AF |
0.75 |
0.00 |
0.40 |
1.00 |
0.49 |
0.29 |
0.20 |
0.60 |
0.60 |
0.50 |
0.65 |
0.00 |
0.10 |
0.10 |
0.20 |
0.33 |
0.26 |
0.57 |
1.00 |
0.20 |
0.60 |
0.14 |
0.69 |
0.40 |
0.13 |
0.45 |
0.20 |
0.10 |
0.67 |
|
|
Dic+cR, % |
BF |
0.00 |
0.35 |
0.27 |
0.00 |
0.31 |
0.40 |
0.00 |
0.20 |
0.20 |
0.08 |
0.21 |
0.00 |
0.00 |
0.00 |
0.17 |
0.00 |
0.70 |
0.00 |
0.30 |
0.00 |
0.33 |
0.00 |
0.00 |
0.10 |
0.00 |
0.00 |
0.00 |
0.00 |
0.20 |
|
|
AF |
0.75 |
0.00 |
0.40 |
1.00 |
0.49 |
0.29 |
0.20 |
0.60 |
0.60 |
0.60 |
0.65 |
0.00 |
0.10 |
0.10 |
0.20 |
0.33 |
0.26 |
0.57 |
1.20 |
0.20 |
0.60 |
0.14 |
0.69 |
0.40 |
0.13 |
0.45 |
0.20 |
0.10 |
0.67 |
|
|
*) The number in parentheses indicates the number of space flights the cosmonauts engaged in. |
|
|
**) Chromosome-type aberrations including dicentrics (Dic) and centric rings (cR). |
|
|
***) Blood sampling before (BF) or after (AF) the flight. |
|
| [4] MIR and ISS missions: Analysis by solid Giemsa method, Durante et al.
2003 |
Reference
Durante, M., Snigiryva, G., Akaeva, E., Bogomazova,
A., Druzhinin, S., Fedorenko, B., Greco, O., Novitskaya, N., Rubanovich,
A., Shevchenko, V., von Recklinghausen, U. and Obe, G. (2003): Chromosomal
aberration dosimetry in cosmonauts after single or multiple space flight.
Cytogenet. Genome Res., 103:40-46.
Chromosome
aberration analysis
Chromosome analyses were carried out in blood
samples from 33 crew members of long-term missions on MIR or the International
Space Station (ISS), and on short-term taxi flights, spanning about ten
years (from 1992 to 2003). Chromosome aberrations were analyzed either
by Giemsa staing or by FISH painting.
|
Flight activities and cumulative doses of cosmonauts |
|
Chromosome analysis before and after the first flight (Giemsa) |
|
Translocation (TR) assay before and after a flight (FISH)*** |
|
|
Cosmonaut |
No. of |
Total time |
Total EVA |
Cumulative |
|
Flight |
Dose |
Before flight |
After flight |
|
Flight at |
Before flight |
After flight |
|
|
code |
space flight |
in space (days) |
time* (h) |
dose** (mGy) |
|
duration (days) |
(mGy) |
Cells |
Dics |
Cells |
Dics |
|
sampling |
Days in space |
Cells |
TR=(FG±SE)×10-3 |
Days in space |
Cells |
TR=(FG±SE)×10-3 |
|
|
3 |
3 |
415 |
20 |
156 |
|
146 |
51 |
200 |
0 |
200 |
1 |
|
3 |
342 |
204 |
0 |
415 |
1,902 |
5.3±2.9 |
|
|
4 |
5 |
651 |
79 |
257 |
|
|
|
|
|
|
|
|
|
|
|
|
|
|
|
|
|
5 |
3 |
748 |
42 |
289 |
|
189 |
81 |
200 |
0 |
930 |
7 |
|
3 |
368 |
941 |
13.4±6.6 |
748 |
1,243 |
10.1±5.0 |
|
|
8 |
4 |
373 |
32 |
126 |
|
|
|
|
|
|
|
|
|
|
|
|
|
|
|
|
|
9 |
4 |
556 |
39 |
187 |
|
|
|
|
|
|
|
|
3 |
357 |
387 |
16.0±12.0 |
546 |
1,277 |
5.2±3.4 |
|
|
10 |
4 |
553 |
31 |
235+STS101 |
|
182 |
94 |
300 |
0 |
900 |
6 |
|
4 |
386 |
1,452 |
13.0±5.0 |
553 |
1,265 |
9.9±4.9 |
|
|
11 |
2 |
382 |
19 |
201 |
|
197 |
99 |
200 |
0 |
220 |
1 |
|
|
|
|
|
|
|
|
|
|
12 |
3 |
341 |
43 |
150 |
|
126 |
67 |
200 |
0 |
352 |
2 |
|
|
|
|
|
|
|
|
|
|
13 |
2 |
138 |
17 |
67+STS106 |
|
126 |
67 |
150 |
0 |
400 |
3 |
|
|
|
|
|
|
|
|
|
|
18 |
2 |
244 |
37 |
96 |
|
115 |
69 |
1,415 |
3 |
1,387 |
9 |
|
2 |
115 |
1,590 |
6.2±3.5 |
244 |
4,005 |
7.5±2.4 |
|
|
19 |
1 |
198 |
25 |
90 |
|
198 |
90 |
1,000 |
2 |
1,000 |
6 |
|
|
|
|
|
|
|
|
|
|
20 |
3 |
330 |
4 |
137 |
|
179 |
113 |
2,100 |
2 |
1,000 |
6 |
|
2 |
179 |
1,293 |
7.7±4.1 |
320 |
1,876 |
6.0±3.0 |
|
|
21 |
2 |
390 |
43 |
143 |
|
194 |
118 |
500 |
0 |
1,000 |
2 |
|
2 |
194 |
520 |
18.0±11.0 |
390 |
1,607 |
24.0±7.0 |
|
|
22 |
1 |
185 |
0 |
102 |
|
185 |
102 |
700 |
2 |
1,000 |
2 |
|
|
|
|
|
|
|
|
|
|
23 |
2 |
382 |
22 |
129 |
|
197 |
97 |
500 |
0 |
1,000 |
1 |
|
|
|
|
|
|
|
|
|
|
24 |
2 |
283 |
31 |
132 |
|
|
|
|
|
|
|
|
|
|
|
|
|
|
|
|
|
25 |
1 |
199 |
6 |
48 |
|
199 |
48 |
1,000 |
3 |
990 |
4 |
|
|
|
|
|
|
|
|
|
|
27 |
1 |
185 |
5 |
32 |
|
185 |
32 |
1,000 |
1 |
1,000 |
0 |
|
1 |
0 |
1,848 |
9.0±4.0 |
185 |
2,059 |
7.8±3.5 |
|
|
28 |
1 |
21 |
0 |
8 |
|
21 |
7.7 |
1,000 |
0 |
1,000 |
1 |
|
|
|
|
|
|
|
|
|
|
29 |
2 |
210 |
6 |
57 |
|
|
|
|
|
|
|
|
|
|
|
|
|
|
|
|
|
30 |
2 |
20 |
0 |
7 |
|
12 |
6 |
1,000 |
2 |
477 |
1 |
|
|
|
|
|
|
|
|
|
|
31 |
1 |
9 |
0 |
SRS89 |
|
|
|
|
|
|
|
|
|
|
|
|
|
|
|
|
|
32 |
2 |
26 |
0 |
16 |
|
|
|
|
|
|
|
|
|
|
|
|
|
|
|
|
|
33 |
1 |
8 |
0 |
6 |
|
8 |
6 |
1,000 |
1 |
1,000 |
4 |
|
|
|
|
|
|
|
|
|
|
36 |
2 |
84 |
5 |
9 |
|
73 |
7.5 |
1,000 |
2 |
1,000 |
0 |
|
1 |
0 |
3,173 |
5.2±2.3 |
73 |
895 |
3.7±3.7 |
|
|
38 |
5 |
624 |
36 |
154+STS60,88 |
|
|
|
|
|
|
|
|
5 |
483 |
462 |
0 |
624 |
1,654 |
2.2±2.2 |
|
|
39 |
1 |
129 |
14 |
27 |
|
129 |
27 |
1,000 |
0 |
1,000 |
2 |
|
1 |
0 |
1,489 |
10.6±4.7 |
129 |
2,355 |
6.8±3.1 |
|
|
40 |
1 |
8 |
0 |
2.2 |
|
|
|
|
|
|
|
|
|
|
|
|
|
|
|
|
|
41 |
1 |
10 |
0 |
2 |
|
10 |
2 |
1,000 |
0 |
1,000 |
1 |
|
|
|
|
|
|
|
|
|
|
43 |
1 |
10 |
0 |
1.8 |
|
10 |
1.8 |
1,000 |
0 |
1,000 |
1 |
|
1 |
0 |
3,397 |
8.7±3.1 |
10 |
1,908 |
5.8±3.3 |
|
|
44 |
1 |
10 |
0 |
1.8 |
|
10 |
1.8 |
1,000 |
1 |
1,000 |
2 |
|
1 |
0 |
1,886 |
10.0±4.0 |
11 |
1,371 |
12.0±5.0 |
|
|
46 |
1 |
11 |
0 |
1.8 |
|
11 |
1.4 |
1,000 |
0 |
1,000 |
2 |
|
|
|
|
|
|
|
|
|
|
47 |
2 |
23 |
0 |
1.4+STS100 |
|
|
|
|
|
|
|
|
|
|
|
|
|
|
|
|
|
*) EVA: extra-vehcular activity. |
|
|
**) Dose from Space Shuttle missions STS60, STS88, STS89, STS100, STS101and STS106 are missing. |
|
|
***) Whole chromosome painting probes are either 1,2; 1,3,5; or 1,4,12
combination cocktail. The translocations were converted to the whole genome
equivalent, FG using the formula of Lucas et al., Int. J. Radiat. Biol., 62:53-63, 1992. |
|
|
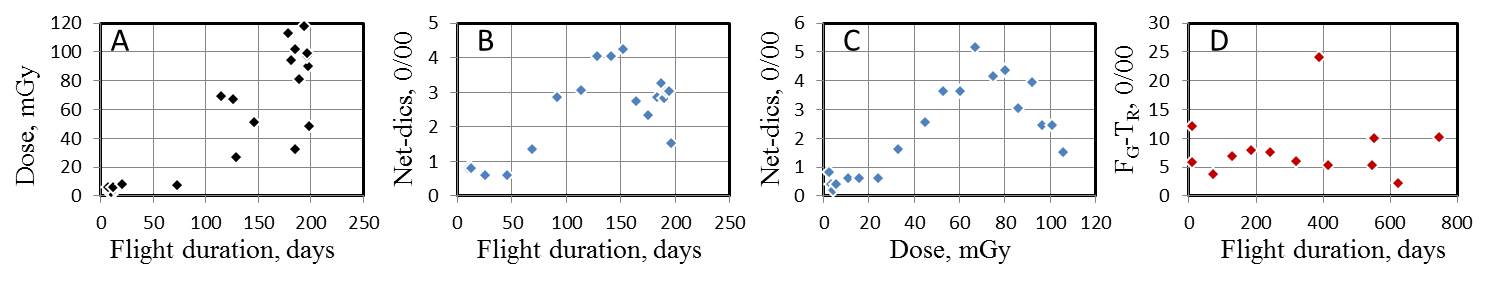
Commentary (Editorial)
Physical dose grossly increases in proportion to the flight duration (A). Dicentric aberrations (net-induced Dics) increases with the increase of flight duration (B) and dose accumulation (C), but reaches a maximum and then tends to decrease with further accumulation of flight duration and dose. However, in contrast, the response of translocations (FG) is refractory to the total duration
of flight (D). Graphs A to C are those smoothed by moving window averaging,
MWA=(w5,s1). The use of translocation assay by FISH in biological dosimetry
should be treated with caution.
|
| [5] Astronauts: Analysis by solid Giemsa and FISH painting methods, Hayata
et al. 2008 |
Reference
Hayata, I., Koike, Y., Minamihisamatsu, M., Yabe, S., Shurshackov, V. A., Snigiryova, G. P. and Bogomazova, A. (2008): Chromosome aberrations in astronauts. In; Taniguchi, K. and Zhang, X. eds., “Advances in Chromosome Sciences”, Vol. 3., pp.110-111.
Chromosome
aberration analysis
Peripheral blood samples were obtained from 5 Russian
astronauts at the Institute of BioMedical Problems (INMP), Russia. The
blood was cultured at the Institute of Roentgenology and Radiology (IRR),
Russia, and the fixed samples were brought to the National Institute of
Radiological Sciences (NIRS), Japan. Chromosomes were studied by both conventional
Giemsa staining method and FISH painting method.
The authors concluded that the frequencies of dicentrics and rings as studied
by solid Giemsa method significantly increaed in the post-flight samples,
but the changes in translocation frequencies as revealed by FISH painting
were not conclusive.
| Expedition |
ID* |
Duration of |
Physical dose |
|
Solid Giemsa staining |
|
FISH painting** |
|
|
mission (days) |
(mSv) |
|
No. of cells |
Dics+cR+Fr |
Freq/1000 |
|
No. of cells |
Complex |
Tr (FG/1000) |
Dic (FG/1000) |
| Expedition 14 |
144b |
|
|
|
2,141 |
3 |
1.40 |
|
3,100 |
2 |
16 (14.3) |
1 (0.9) |
|
155a |
198 |
104 |
|
1,745 |
7 |
4.01 |
|
3,050 |
1 |
8 (7.3) |
4 (3.6) |
| Expedition 14 |
146b |
|
|
|
2,331 |
1 |
0.43 |
|
3,050 |
0 |
9 (8.2) |
1 (0.9) |
|
156a |
198 |
104 |
|
991 |
2 |
2.02 |
|
2,443 |
1 |
12 (13.7) |
1 (1.1) |
| Expedition 15 |
152b |
|
|
|
2,076 |
7 |
3.37 |
|
3,050 |
0 |
11 (10.0) |
2 (1.8) |
|
164a |
192 |
111 |
|
1,694 |
8 |
4.72 |
|
|
|
|
|
| - |
159b |
|
|
|
2,002 |
3 |
1.50 |
|
3,021 |
0 |
3 (2.8) |
3 (2.8) |
| - |
161b |
|
|
|
2,003 |
8 |
3.99 |
|
3,409 |
3 |
13 (10.6) |
2 (1.6) |
| *) (b): sampling before mission. (a): sampling after mission. |
| **)HISH with whole chromosome painting probes for chromosome 1, 2 and 4. |