| Cytogenetics in radiotherapy [I] |
Since the first observation on the induction of chromosome aberrations
in blood lymphocytes of patients received radiotherapy by I. M. Tough,
K. E. Buckton, A. G. Baikie and W. M. Court Brown in 1960 (Tough et al.,
Lancet, ii:849-851, 1960), lymphocyte chromosome aberration analysis rapidly
expanded in varying area of radiation cytogenetics of humans exposed to
ionizing radiation. Chromosome aberration analysis provides not only a
quantitative measure of the biological effects of radiation in humans (IAEA
Technical Report 2011; ISCN 2016) but also an important information in
establishing correct clinical management in radiotherapy and radiation
accident.
| [1] Lymphocyte lifetime: Determination by elimination rate of chromosome
aberration in radiotherapy patients |
In the early stage of study, the estimation
of lymphocyte lifetime has been made by the use of chromosome aberrations
of peripheral blood lymphocytes of patients received radiotherapy. The
knowledge has has been an important parameter in biological dosimetry for
low dose and low dose-rate radiation exposure and estimation of dose of
the past exposure (retrospective biodosimetry). The followings are typical
examples of such studies; one by Norman et al. (1965) in patients received
radiotherapy for cervical cancer and another by Buckton et al. (1967) in
patients received radiotherapy for ankylosing spondylitis. The lymphocyte
mean lifetime has been estimated to m=530±64 days in Norman et al. (1965)
and m=1,574 (50% CI; 891, 6,743) days in Buckton et al. (1967) (fitting to data
for longer than 1400 days). The difference may come from the inclusion
of rapid decline in post-therapy early stage by lymphocyte renewal in the
former and significant contribution of long-lived memory cells (Bogen,
1993). Currently, a value of about 1,000 days is often applied. The followings
are the revisit to the original data to encourage the reanalysis.
[A] Analysis in 25 patients treated with gamma-rays for cervical cancer.
Threatment was carried out to give 6,000-8,000 rad to paracervical triangle
over a period of 4-6 weeks. It was estimated that 5-10 % of body mass was
in the direct irradiation field, and the rest of the body mass, except
for circulating cells, received about 10 rad.
Reference
Norman, A., Sasaki, M. S., Ottoman, R. E.
and Fingerfut, A. G. (1965): Lymphocyte lifetime in women. Science, 147:1007-1013.
Norman, A., Sasaki, M. S., Ottoman, R. E.
and Fingerfut, A. G. (1966): Elimination of chromosome aberrations from
human lymphocytes. Blood, 27:706-714.
Sasaki, M. S. and Norman, A. (1967): Selection against chromosome aberrations in human lymphocytes. Nature, 214:502-503.
[B] and [C] Analysis in 58 patients treated X-rays for ankylosing spondylitis.
Irradiation was applied along the spinal strip field to give a total skin
dose of 1,500, 2,000 or 2,500 rads in 10 fractions in 12 to 14 days.
Reference
Buckton, K. E., Jacobs, P. A., Court Brown,
W. M. and Doll, R. (1962): A study of the chromosome damage persisting
after X-ray therapy for ankylosing spondylitis. Lancet, ii:676-682.
Court Brown, W. M., Buckton, K. E. and McLean, A. S. (1965): Quantitative studies of chromosome aberrations in man following acute and chronic exposure to X rays and gamma rays. Lancet, i:1239-1241.
Buckton, K. E., Smith, P. G. and Court Brown, W. M. (1967): The estimation of lymphocyte lifespan from studies on males treated with X-rays for ankylosing spondylitis. In; Evans, H. J., Court Brown, W. M. and McLean, A. S., eds., Human Radiation Cytogenetics, Amsterdam, North Holland, pp.106-114.
Buckton, K. E., Hamilton, G. E., Paton, L.
and Langlands, A. O. (1978): Chromosome aberrations in irradiated ankylosing
spondylitis patinets. In; Evans, H. J. and Lloyd, D. C., eds., Mutagen-induced
Chromosome Damage in Man. Edinburgh University Press, pp.142-150.
Buckton, K. E. (1983): Chromsome aberrations
in patients treated with X-rays for ankylosing spondylitis. In; Ishihara,
T. and Sasaki, M. S., eds., Radiation-induced Chromosome Damage in Man.
Alan R. Liss, Inc., New York, pp.491-511.
| . |
|
|
|
|
|
|
|
|
|
|
|
|
|
|
|
|
|
|
|
|
|
|
|
|
[A] Norman et al. 1966 (72-h culture) |
|
|
[B] Buckton et al. 1978 (40-50 hour culture) |
|
[C] Buckton et al. 1967 (40-50 hour culture)a |
|
|
Post-RTa |
No. of |
No. of |
No. of |
No. of |
No. of |
|
Post-RTa |
No. of |
No. of |
No. of |
No. of |
No. of |
No. of |
|
Post-RTb |
No. of |
No. of |
No. of |
No. of |
No. of |
|
|
(days) |
cells |
Dic+Ring |
Acentrics |
Cu-cellsb |
Cs-cellsc |
|
(yr) |
cells |
Dicentric |
Rings |
Acentrics |
Cu-cellsb |
Cs-cellsc |
|
(days) |
mean |
sampling |
cells |
Cu-cells |
X1Cu-cellsc |
Cs-cells |
|
|
7 |
47 |
11 |
23 |
12 |
7 |
|
<0.08 |
1,375 |
446 |
57 |
230 |
517 |
135 |
|
0-10 |
1.2 |
12 |
555 |
201 |
168 |
54 |
|
|
13 |
100 |
17 |
29 |
16 |
11 |
|
0.08-0.5 |
930 |
263 |
39 |
169 |
305 |
103 |
|
11-20 |
16.4 |
10 |
457 |
160 |
143 |
46 |
|
|
15 |
324 |
54 |
93 |
53 |
30 |
|
0.5-1.5 |
1,097 |
168 |
13 |
116 |
206 |
113 |
|
21-50 |
29.9 |
11 |
530 |
195 |
167 |
57 |
|
|
25 |
140 |
57 |
79 |
35 |
13 |
|
1.5-2.5 |
350 |
46 |
6 |
24 |
60 |
49 |
|
51-100 |
68.5 |
8 |
380 |
130 |
103 |
40 |
|
|
33 |
78 |
21 |
41 |
18 |
8 |
|
2.5-3.5 |
393 |
24 |
3 |
15 |
28 |
34 |
|
101-200 |
146.3 |
9 |
450 |
139 |
100 |
53 |
|
|
45 |
49 |
7 |
19 |
9 |
6 |
|
3.5-4.5 |
990 |
38 |
8 |
30 |
54 |
89 |
|
201-400 |
299.6 |
11 |
577 |
142 |
111 |
66 |
|
|
64 |
160 |
20 |
40 |
16 |
20 |
|
4.5-5.5 |
1,812 |
83 |
4 |
46 |
96 |
164 |
|
401-800 |
592.0 |
10 |
575 |
73 |
56 |
58 |
|
|
103 |
44 |
6 |
10 |
4 |
4 |
|
5.5-6.5 |
1,336 |
44 |
10 |
23 |
53 |
170 |
|
801-1400 |
1,017.9 |
10 |
500 |
41 |
32 |
41 |
|
|
115 |
100 |
26 |
20 |
13 |
14 |
|
6.5-7.5 |
2,043 |
55 |
3 |
34 |
62 |
190 |
|
1401-1800 |
1,563.9 |
7 |
400 |
20 |
16 |
26 |
|
|
116 |
68 |
8 |
9 |
6 |
7 |
|
7.5-8.5 |
1,422 |
39 |
11 |
19 |
45 |
124 |
|
1801-1900 |
1,834.8 |
9 |
583 |
37 |
34 |
43 |
|
|
127 |
100 |
16 |
27 |
15 |
14 |
|
8.5-9.5 |
1,410 |
18 |
6 |
10 |
24 |
128 |
|
1901-2400 |
2,083.5 |
9 |
650 |
31 |
22 |
65 |
|
|
157 |
80 |
17 |
29 |
10 |
13 |
|
9.5-10.5 |
1,575 |
26 |
2 |
25 |
38 |
155 |
|
2401-2700 |
2,599.0 |
11 |
830 |
36 |
28 |
72 |
|
|
168 |
55 |
5 |
12 |
6 |
3 |
|
10.5-11.5 |
1,320 |
10 |
2 |
9 |
18 |
165 |
|
2701-3200 |
2,953.6 |
6 |
450 |
11 |
7 |
29 |
|
|
195 |
100 |
15 |
31 |
11 |
10 |
|
11.5-12.5 |
960 |
8 |
1 |
7 |
12 |
87 |
|
3201-3700 |
3,420.4 |
6 |
500 |
11 |
13 |
49 |
|
|
229 |
51 |
4 |
8 |
6 |
4 |
|
12.5-13.5 |
935 |
14 |
2 |
7 |
17 |
87 |
|
a) This table is derived from the data in Table [B]. |
|
|
330 |
50 |
3 |
7 |
4 |
5 |
|
13.5-14.5 |
991 |
10 |
1 |
14 |
19 |
142 |
|
b) time after the end of therapy (days). |
|
|
413 |
200 |
15 |
12 |
7 |
13 |
|
14.5-15.5 |
1,350 |
4 |
1 |
5 |
9 |
115 |
|
c) X1Cu-cells: cells with at least one dissimilar fragment with or without
dics or rings. |
|
|
477 |
73 |
14 |
15 |
9 |
7 |
|
15.5-16.5 |
1,150 |
11 |
1 |
6 |
17 |
128 |
|
|
|
|
|
|
|
|
|
|
545 |
78 |
14 |
21 |
7 |
9 |
|
16.5-17.5 |
830 |
8 |
1 |
3 |
8 |
82 |
|
|
|
|
|
|
|
|
|
|
631 |
100 |
3 |
4 |
3 |
5 |
|
17.5-18.5 |
1,340 |
8 |
2 |
15 |
21 |
197 |
|
|
|
|
|
|
|
|
|
|
647 |
80 |
3 |
11 |
4 |
10 |
|
18.5-19.5 |
920 |
4 |
1 |
4 |
9 |
117 |
|
|
|
|
|
|
|
|
|
|
719 |
83 |
3 |
6 |
5 |
11 |
|
19.5-20.5 |
980 |
5 |
0 |
3 |
6 |
86 |
|
|
|
|
|
|
|
|
|
|
977 |
80 |
7 |
12 |
5 |
9 |
|
20.5-21.5 |
550 |
3 |
0 |
3 |
4 |
81 |
|
|
|
|
|
|
|
|
|
|
1,000 |
63 |
1 |
0 |
0 |
8 |
|
21.5-22.5 |
380 |
0 |
1 |
0 |
2 |
24 |
|
|
|
|
|
|
|
|
|
|
1,125 |
59 |
4 |
6 |
2 |
7 |
|
22.5-23.5 |
810 |
4 |
2 |
7 |
13 |
45 |
|
|
|
|
|
|
|
|
|
|
1,285 |
180 |
0 |
3 |
3 |
15 |
|
23.5-24.5 |
510 |
3 |
0 |
1 |
5 |
36 |
|
|
|
|
|
|
|
|
|
|
1,305 |
100 |
1 |
1 |
1 |
7 |
|
24.5-25.5 |
325 |
0 |
0 |
1 |
1 |
33 |
|
|
|
|
|
|
|
|
|
|
1,382 |
117 |
2 |
0 |
0 |
6 |
|
25.5-26.5 |
225 |
2 |
0 |
0 |
4 |
21 |
|
|
|
|
|
|
|
|
|
|
1,627 |
82 |
1 |
0 |
0 |
5 |
|
26.5-27.5 |
300 |
0 |
0 |
0 |
1 |
23 |
|
|
|
|
|
|
|
|
|
|
1,946 |
50 |
0 |
0 |
0 |
4 |
|
27.5-28.5 |
200 |
0 |
0 |
0 |
0 |
10 |
|
|
|
|
|
|
|
|
|
|
2,870 |
100 |
0 |
0 |
0 |
7 |
|
>29 |
260 |
5 |
0 |
1 |
5 |
18 |
|
|
|
|
|
|
|
|
|
|
2,909 |
51 |
1 |
0 |
0 |
3 |
|
a) Time after radiation therapy (years). |
|
|
|
|
|
|
|
|
|
|
2,822 |
100 |
0 |
0 |
0 |
6 |
|
b) Cu-cells: cells with unstable aberrations (dicentrics, rings, acentric fragments). |
|
|
|
|
|
|
|
|
|
|
3,622 |
46 |
0 |
0 |
0 |
4 |
|
c) Cs-cells: cells with stable-type rearrangements only. |
|
|
|
|
|
|
|
|
|
|
3,704 |
100 |
1 |
0 |
0 |
8 |
|
|
|
|
|
|
|
|
|
|
|
|
|
|
|
|
|
|
4,920 |
160 |
1 |
0 |
0 |
5 |
|
|
|
|
|
|
|
|
|
|
|
|
|
|
|
|
|
|
a) Time after radiation therapy (days). |
|
|
|
|
|
|
|
|
|
|
|
|
|
|
|
|
|
|
b) Cu-cells: cells with at least one acentric fragment. |
|
|
|
|
|
|
|
|
|
|
|
|
|
|
|
|
|
|
c) Cs-cells: quasidiploid cells: cells with stable rearrangements only. |
|
|
|
|
|
|
|
|
|
|
|
|
|
|
|
|
|
|
|
|
|
|
|
|
|
|
|
|
|
|
|
|
|
|
|
|
|
|
|
|
. |
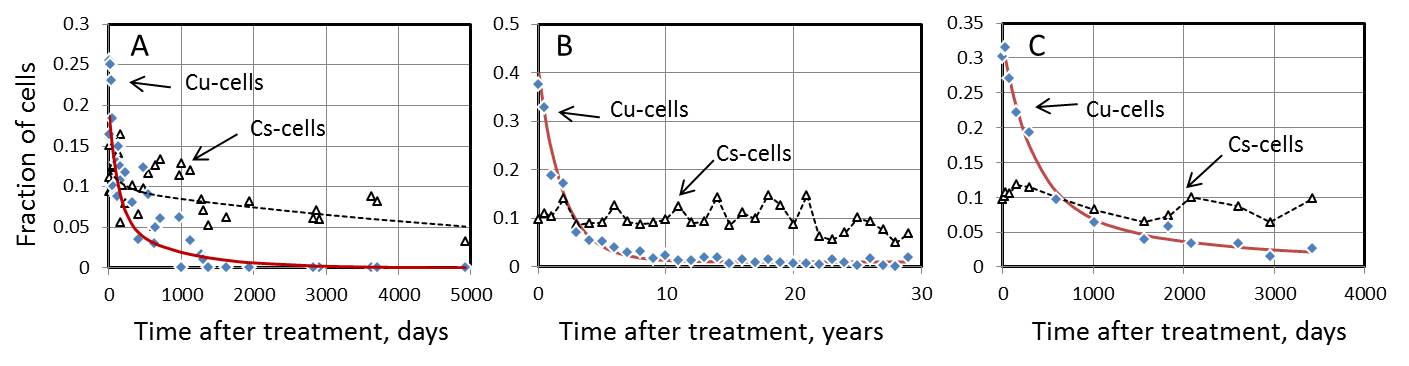
Commentary: Curve fitting (red lines)
The frequencies of cells, p(t), against time (t) after the end of radiotherapy were fitted to the following
formula by iteratively re-weight maximum likelihood combined with bootstrap resampling.
p(t)+p(0)=a∙exp(-b∙t)+c∙exp(-d∙t),
where p(0) is spontaneous frequency, and a, b,
c and d are parameters. Spontaneous frequency was p(0)=0 for Norman et al. (1966) and p(0)=0.011 for Buckton et al. (1967). In the right-hand terms, the
first term represents a decline by lymphocyte recovery from radiation damage
with a mean survival time of 1/b and
the second term represents a decline due to lymphocyte turnover with mean
lifetime of 1/d.
| . |
|
|
Access to Norman et al 1965, 1966 |
|
Access to Buckton et al. 1978 |
|
Access to Buckton et al. 1967 |
|
Parameter |
|
[A] |
|
[B] |
|
[C] |
|
|
|
Cu-cells |
Cs-cells |
|
Cu-cells |
|
X1Cu-cells |
|
a |
|
(1.222±0.266)×10-1/day |
(9.659±0.525)×10-2/day |
|
(2.110±1.539)×10-1/year |
|
(2.193±0.127)×10-1/day |
|
b |
|
(1.499±1.149)×10-2/day |
(1.292±0.844)×10-4/day |
|
(6.560±5.721)×10-1/year |
|
3.063±0.334)×10-3/day |
|
c |
|
(1.024±0.393)×10-1/day |
(2.402±0.463)×10-2/day |
|
(1.875±1.449)×10-1/year |
|
(8.853±1.110)×10-2/day |
|
d |
|
(1.383±0.260)×10-3/day |
(4.992±2.328)×10-3/day |
|
(4.070±3.763)×10-1/year |
|
(6.274±0.992)×10-4/day |
|
p(0) |
|
0 |
0 |
|
0.011 |
|
0.011 |
|
mean lifetime, m=1/d |
|
723 days |
|
|
2.46 year (897 days) |
|
1594 days |