| Cytogenetics in radiotherapy [II] |
Since the first observation on the induction of chromosome aberrations
in blood lymphocytes of patients received radiotherapy by I. M. Tough,
K. E. Buckton, A. G. Baikie and W. M. Court Brown in 1960 (Tough et al.,
Lancet, ii:849-851, 1960), lymphocyte chromosome aberration analysis rapidly
expanded in varying area of radiation cytogenetics of humans exposed to
ionizing radiation. Chromosome aberration analysis provides not only a
quantitative measure of the biological effects of radiation in humans (IAEA
Technical Report 2011; ISCN 2016) but also an important information in
establishing correct clinical management in radiotherapy and radiation
accident. The selective accumulation of iodine-131 (131I) in thyroid is an underlying strategy for the treatment of thyroid diseses
with 131I. The selective accumulation of 131I released from nuclear power plant accident has been a major concern about
the development of thyroid cancer in children after nuclear power plant
accidents. Indeed, elevated level of chromosome aberrations have been found
in Belarussian children after Chernobyl accident (e.g., Lehmann et al.,
Int. J. Radiat. Biol., 70:513-516, 1996; Zitzeisberger et al., Cancer Res.,
59:135-140, 1999).
| [2] Selective treatment of thyroid disease by iodine-131 (Blackwell et al. 1974) |
Reference
Blackwell, N., Stevenson, A. C. and Wiernik, G. (1974): Chromosomal findings in patients treated with small doses of iodine-131. Mutation Res., 25:397-402.
Chromosome
aberration analysis
Chromosome analysis (48 h culture) has been
performed on lymphocytes of 31 patients who had been treated with relatively
small oral doses of 131I for
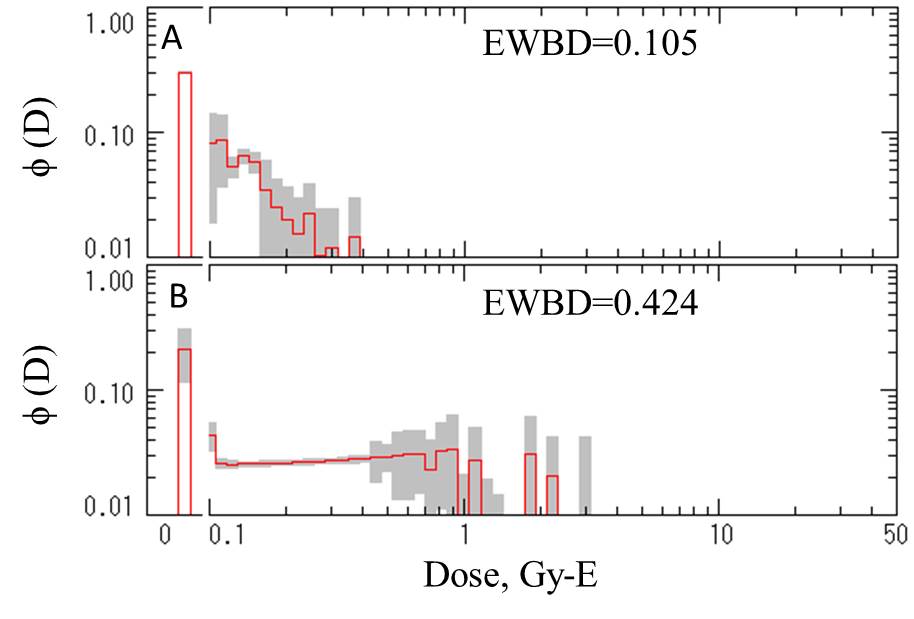
hyperthyroidism. All patients received the tracer doses (2 μCi~8μCi of 131I)
in a form of sodium iodine (Na131I). In three patients, chromosomes
were also analyzed before treatment. Thyroid rate factors were determined by
multiple urine samples over 24 h period.
In
these hyperthyroid patients, the mean activity of 131I ingested was 8.8 mCi
(325.6 MBq). The whole-body dose from both β and γ radiation would be about
10.6 mrad (0.106 mGy).
The observed chromosome aberration frequencies
were far larger than expectation, suggesting a selective irradiation of
lymphocytes.
| Patient | Sex | Age | No. of | Dose | Mean interval between | No. of | Chromosome aberrations | Cells with indicated number of dics | |||||||
| ID | (M/F) | (year) | treatments | (mCi) | dose and sampling (months) | cells | Dics | cR | 0 | 1 | 2 | 3 | |||
| Post-treatment | 2 | F | 60 | 1 | 7 | 8 | 100 | 0 | 0 | 100 | 0 | 0 | 0 | ||
| 4 | F | 65 | 1 | 5 | 18 | 100 | 0 | 0 | 100 | 0 | 0 | 0 | |||
| 7 | F | 70 | 3 | 16.5 | 54 | 200 | 2 | 0 | 198 | 2 | 0 | 0 | |||
| 8 | F | 73 | 1 | 8 | 46 | 100 | 0 | 0 | 100 | 0 | 0 | 0 | |||
| 9 | F | 52 | 1 | 5 | 15 | 100 | 3 | 0 | 99 | 0 | 0 | 1 | |||
| 10 | F | 45 | 1 | 6 | 19 | 200 | 4 | 0 | 196 | 4 | 0 | 0 | |||
| 11 | F | 49 | 2 | 18 | 11 | 200 | 0 | 0 | 200 | 0 | 0 | 0 | |||
| 12 | F | 66 | 1 | 12 | 144 | 200 | 0 | 0 | 200 | 0 | 0 | 0 | |||
| 13 | F | 82 | 3 | 23 | 50 | 200 | 0 | 0 | 200 | 0 | 0 | 0 | |||
| 14 | F | 49 | 2 | 12 | 7 | 200 | 0 | 1 | 200 | 0 | 0 | 0 | |||
| 15 | F | 67 | 2 | 10 | 4 | 300 | 5 | 0 | 297 | 2 | 0 | 1 | |||
| 16 | F | 68 | 1 | 5 | 36 | 100 | 0 | 0 | 100 | 0 | 0 | 0 | |||
| 17 | F | 49 | 1 | 8 | 72 | 100 | 0 | 0 | 100 | 0 | 0 | 0 | |||
| 18 | M | 69 | 1 | 7 | 60 | 100 | 5 | 1 | 96 | 3 | 1 | 0 | |||
| 19 | M | 42 | 1 | 5 | 8 | 100 | 0 | 0 | 100 | 0 | 0 | 0 | |||
| 21 | F | 55 | 1 | 7 | 19 | 100 | 1 | 0 | 99 | 1 | 0 | 0 | |||
| 22 | F | 76 | 1 | 5 | 33 | 100 | 2 | 0 | 98 | 2 | 0 | 0 | |||
| 23 | F | 75 | 1 | 8 | 72 | 200 | 1 | 0 | 199 | 1 | 0 | 0 | |||
| 24 | M | 43 | 1 | 5 | 2 | 200 | 0 | 0 | 200 | 0 | 0 | 0 | |||
| 25 | F | 76 | 3 | 22 | 158 | 200 | 1 | 0 | 199 | 1 | 0 | 0 | |||
| 27 | F | 76 | 1 | 10 | 24 | 200 | 1 | 0 | 199 | 1 | 0 | 0 | |||
| 28 | F | 29 | 1 | 5 | 15 | 100 | 1 | 0 | 99 | 1 | 0 | 0 | |||
| 29 | F | 51 | 1 | 8 | 1 | 200 | 4 | 0 | 196 | 4 | 0 | 0 | |||
| 30 | F | 68 | 1 | 5 | 24 | 200 | 1 | 0 | 199 | 1 | 0 | 0 | |||
| 31 | M | 42 | 2 | 20.5 | 160 | 200 | 3 | 0 | 199 | 0 | 0 | 1 | |||
| 33 | F | 80 | 1 | 5 | 1 | 100 | 2 | 0 | 99 | 0 | 1 | 0 | |||
| 36 | F | 42 | 1 | 5 | 1 | 100 | 6 | 0 | 96 | 2 | 2 | 0 | |||
| 45 | F | 67 | 1 | 5 | 1 | 100 | 2 | 0 | 98 | 2 | 0 | 0 | |||
| 6 | F | 67 | 1 | 5 | 1 | 100 | 6 | 0 | 96 | 2 | 2 | 0 | |||
| 3 | F | 80 | 1 | 5 | 1 | 100 | 2 | 1 | 99 | 0 | 1 | 0 | |||
| 5 | F | 42 | 1 | 5 | 1 | 100 | 2 | 0 | 98 | 2 | 0 | 0 | |||
| Total | 4,600 | 54 | 3 | 4,559 | 31 | 7 | 3 | ||||||||
| Pre-treatment | 6 | F | 67 | - | - | - | 100 | 0 | 0 | 100 | 0 | 0 | 0 | ||
| 3 | F | 80 | - | - | - | 100 | 1 | 0 | 99 | 1 | 0 | 0 | |||
| 5 | F | 42 | - | - | - | 100 | 0 | 0 | 100 | 0 | 0 | 0 | |||
| Total | 300 | 1 | 0 | 299 | 1 | 0 | 0 | ||||||||
|
Commentary: The dose distribution profiles revealing localized dose to lymphocytes. [A] Pre-treatment. [B] After oral administration of Na131I. EWBD: equivalent whole-bady dose (Gy-E). |
| [3] Selective treatment of thyroid disease by iodine-131 (Gundy et al. 1996) |
Reference
Gundy, S., Katz, N., Fuzy, M. and Esik, O. (1996): Cytogenetic study of
radiation burden in thyroid disease patients treated with external irradiation
or radioiodine. Mutation Res., 360:107-113.
Chromosome
aberration analysis
This study was carried out in patients with
thyroid cancer treated with different therapeutic modalities as, (A) patients
received thyroidectomy only, (B) thyroid cancer patients were treated with
60Co γ-rays or X-rays (photon energy of 6 and 9 MV) following thyroidectomy,
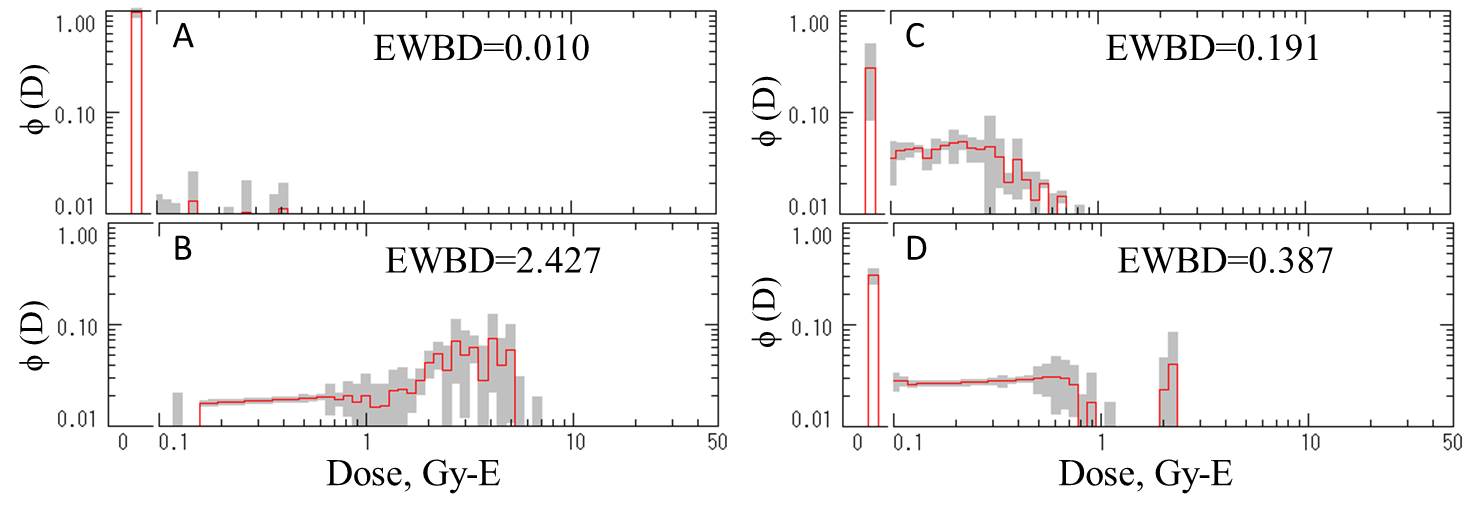
(C) patients undergoing thyroid ablation received 1734-2600 MBq Na131I orally, (D) patients with thyrotoxic
disease (Basedow-Graves or toxic adenoma) in whom thyroid glands were remained
intact and orally treated with 185-595 MBq Na131I. In addition, age and sex matched controls were also studied.
| Subject category | Surgical | Radiological | No. of | Administration | No. of cells | Chromosome aberrations | Distribution of cells with indicated number of dics+rings | |||||||||||
| treatment | treatment | subject | observed | Aberrant cells | Chr.Frag | Dics+rings | Transloc. | 0 | 1 | 2 | 3 | 4 | 5 | |||||
| Controls | Healthy person | none | none | 14 | 1,400 | 7 | 3 | 0 | 0 | 1400 | - | - | - | - | - | |||
| [A] | Thyroid cancer | Thyroidectomy | none | 14 | 1,400 | 21 | 6 | 3 | 2 | 1398 | 1 | 1 | - | - | - | |||
| [B] | Thyroid cancer | Thyroidectomy | Eexternal γ- or X-rays** | 7 | 50 Gy | 700 | 173 | 68 | 196 | 1 | 566 | 90 | 32 | 7 | 4 | 1 | ||
| [C] | Thyroid cancer | Thyroidectomy | Radioiodine (Na131I oral) | 12 | 1,734-2,600 MBq | 1,200 | 33 | 7 | 12 | 2 | 1188 | 12 | - | - | - | - | ||
| [D] | Thyrotoxic disease* | none | Radioiodine (Na131I oral) | 8 | 185-595 MBq | 800 | 40 | 22 | 18 | 5 | 787 | 9 | 3 | 1 | - | - | ||
| *) 3 Basedow-Graves and 5toxic denoma patients. | ||||||||||||||||||
| **) 5 patients received 60Co gamma-rays, and 2 patients received X-rays with 6 MV and 9 MV photons, respectively in daily fraction of 2 Gy of tumor dose. | ||||||||||||||||||
|
Commentary: The dose distribution profiles. [A] Thyroidectomy only. [B] Thyroidectomy
followed by gamma- or X-ray treatment. [C] Thyroidectomy followed by oral
administration of Na131I. |