Residents of High Natural Background Radiation Area |
Background radiation in the environment comprises
of variety of sources including both natural and artificial radiation.
Natural background radiation (NBR) is defined as radiation of the non-artificial
sources of apparent origin and sometimes simply referred to as background
radiation (BR) for the environmental interest. Its origin is inhalation
of air (mainly 222Ra), ingestion of food
and water (40K, 14C, etc.), terrestrial radiation from
ground (depending on soil materials), and cosmic radiation (solar and galactic
origin). The levels of natural background radiation vary with location, time
and altitude. The global average effective dose to humans has been estimated to
be 2.40 mSv/year (UNSCEAR Report 2000). This level in Japan is 1.50 mSv/year (http://search.kankyo-housyasen.go.jp).
However, several regions in the world are
known as high background radiation area (here we call HBRA), where the
natural background radiation is far excess of the world average one. They
include Guarapari (Brazil), Kerala (India), Ramsar (Iran) and Yangjiang
(China). Since the exposure levels in these areas are several times (some
tenths of times in particular area) higher than the recommended limit for
exposure to the public from artificial sources (ICRP 2007 Recommendations;
1 mSv that may have a 5.5% chance of developing cancer), the health consequences
of the residents has been continued concern in radioprotection and radiobiological
sciences.
[1] Yangjiang, China |
Scenario: 
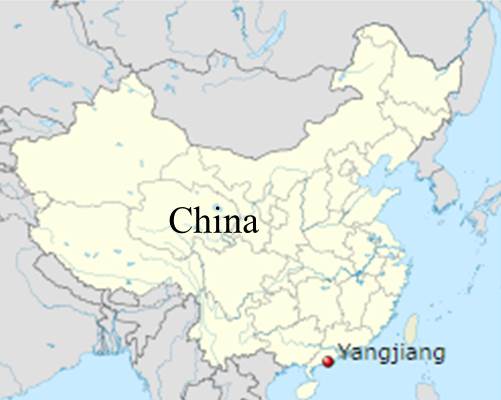
Yangjiang county, Guangdon province, is located in the southern China. During geologic history, monazite in mountains was washed out by rain and radionuclide containing monazite sands have been accumulated in the basin region resulting in a high background radiation area (HBRA). Following the pioneer work by High Background Radiation Research Group of China (Science 209:877-880, 1980), China-Japan cooperative research was established in 1991 and comprehensive studies on cancer risk and cytogenetic analysis on the inhabitants have been carried out until 2001 (Wei, L. and Sugahara, T., J. Radiat. Res., 41<suppl>:1-7, 2000). The high level of background radiation in this area is due to 232Th and 238U and their decay products. Control populations (CA) were taken from neighboring Hampizai village but without high background radioactivity. The ambient dose to the residents was estimated by NaI (T1) scintillation counter for indoor and outdoor dose and by personal monitors of electronic pocket dosimeter and thermoluminescence dosimeter (TLD). The external dose measure by TLD was converted to the personal dose by conversion from mR to mGy and further to personal dose with phantom using conversion factor of 0.87 and 0.96, respectively. (Morishima, H. et al. J. Radiat. Res., 41<suppl>:9-23, 2000; Nakai, S. et al. (1997): In, Wei, L. et al. eds. High Levels of Natural Radiation 1996: Radiation Dose and Health Effects, Elsevier, Amsterdam, pp.307-315.). |
![]() |
1.1. Estimation of personal dose: Nakai, S. et al. (1997): In, Wei, L. et al. eds. High Levels of Natural Radiation 1996: Radiation Dose and Health Effects, Elsevier, Amsterdam, pp.307-315.). |
Personal dose monitoring by TLD carried by residents for 2 months* (data as of 1996). | |||||||||||||||||||
High natural background radiation area (HBRA) | Control area (CA) | ||||||||||||||||||
Family | Family member | Measured | Dose rate** | Family | Family member | Measured | Dose rate** | ||||||||||||
1 | 2 | 3 | 4 | 5 | mean±SD | (mGy/year) | 1 | 2 | 3 | 4 | 5 | 6 | mean±SD | (mGy/year) | |||||
A | M(64):478 | F(59):424 | F(30):365 | F(9):379 | M(36):390 | 407.2±45.1 | 3.42 | K | F(62):75 | M(38):77 | F(32):76 | M(12):81 | 77.3±2.6 | 0.65 | |||||
B | M(68):407 | F(58):362 | M(33):371 | F(13):388 | 382.0±62.6 | 3.21 | L | M(63):80 | F(55):77 | F(26):83 | M(8):92 | 83.0±6.5 | 0.70 | ||||||
C | F(55):406 | M(34):369 | F(28):421 | 398.7±26.8 | 3.35 | M | M(70):86 | F(37):70 | F(10):107 | 87.7±18.6 | 0.74 | ||||||||
D | M(66):429 | F(53):404 | M(35):371 | F(32):380 | M(10):407 | 398.2±23.1 | 3.35 | N | M(64)93 | F(61):84 | M(35):97 | M(32):95 | F(34):93 | F(8):84 | 91.0±5.6 | 0.77 | |||
E | M(80):389 | M(43):511 | F(39):537 | F(11):448 | 471.3±66.4 | 3.96 | P | M(64):64 | F(56):77 | M(26):103 | F(30):78 | F(9):92 | 82.8±17.8 | 0.70 | |||||
F | F(70):489 | M(14):480 | M(80):454 | F(38):485 | M(48):473 | 476.2±13.8 | 4.00 | *) The data should as [sex](age in year):[TLD reading in mR/y]. Contribution of cosmic rays was estimated to be 0.23mGy/y. | |||||||||||
G | M(77):447 | F(66):450 | F(10):436 | M(28):485 | M(31):458 | 455.2±18.4 | 3.83 | **) TLD dose in mR unit was converted to mGy and further to personal dose by conversion factor of 0.87 and 0.96, respctively. |
1.2. Chromosome aberration analysis (Dic+cR) |
Blood samples were taken from 22 members from 8 households in high background radiation area (HBRA) and 17 members from 5 households in control area (CA). Dicentric chromosomes (Dic) and centric rings (cR) were scored in solid Giemsa stained preparations by the aid of metaphase finding system. Cumulative dose was 130.9-358.9 mGy for residents of HBRA and 6.0-59.2 mGy for those of CA. Average dose rate was 3.70 mGy/y for HBRA and 0.70 mGy/y for CA. |
References |
Jiang, T., Wang, C. –Y., Chen, D. –Q., Yuan,
Y., Wei, L. –X., Hayata, I., Morishima, H., Nakai, S. and Sugahara, T.
(1997): Preliminary report on quantitative study of chromosome aberrations
following life time exposure to high background radiation in China. In:
Wei, L. –X., Sugahara, T. and Tao, Z. eds., High Levels of Natural Radiation:
Radiation Dose and Health Effects. Elsevier, Amsterdam, pp.301-306. |
[1] High background radiation area (HBRA) | [2] Control area (CA) | |||||||||||
Subject | Age | Dose/y | Total dose | Cells | No. of | Subject | Age | Dose/y | Total dose | Cells | No. of | |
code | (y) | (mGy)* | (mGy) | scored | Dic+cR | code | (y) | (mGy)* | (mGy) | scored | Dic+cR | |
A01 | 64.1 | 3.68 | 235.9 | 3,092 | 13 | L02 | 55.8 | 0.72 | 40.2 | 2,006 | 2 | |
A03 | 37.1 | 3.57 | 132.4 | 1,781 | 6 | L06 | 26.7 | 0.68 | 18.2 | 3,081 | 3 | |
A09 | 9.4 | 3.29 | 30.9 | 2,037 | 1 | L07 | 8.2 | 0.90 | 7.4 | 3,056 | 3 | |
B01 | 68.9 | 3.28 | 226.0 | 3,034 | 9 | M01 | 70.5 | 0.84 | 59.2 | 2,016 | 3 | |
B05 | 33.3 | 3.56 | 118.5 | 3,011 | 7 | M04 | 37.8 | 0.67 | 25.3 | 3,021 | 3 | |
B11 | 11.6 | 3.40 | 39.4 | 2,044 | 3 | M08 | 10.3 | 0.75 | 7.7 | 3,032 | 4 | |
D01 | 72.8 | 3.00 | 218.4 | 3,020 | 11 | N01 | 64.9 | 0.74 | 48.0 | 2,010 | 4 | |
D03 | 34.1 | 3.28 | 111.8 | 3,060 | 7 | N04 | 32.9 | 0.76 | 25.0 | 2,823 | 4 | |
D12 | 11.2 | 3.54 | 39.6 | 2,047 | 2 | N08 | 8.2 | 0.73 | 6.0 | 2,009 | 3 | |
E01 | 80.8 | 2.74 | 221.4 | 2,569 | 14 | P01 | 64.4 | 0.69 | 44.4 | 1,908 | 3 | |
E08 | 11.5 | 3.56 | 40.9 | 2,004 | 2 | P02 | 56.3 | 0.60 | 33.8 | 1,889 | 0 | |
F01 | 80.7 | 3.89 | 313.9 | 2,970 | 15 | P05 | 30.8 | 0.63 | 19.4 | 3,104 | 5 | |
F07 | 13.2 | 4.21 | 55.6 | 2,030 | 2 | P08 | 9.8 | 0.64 | 6.3 | 2,125 | 1 | |
G01 | 77.2 | 3.52 | 271.7 | 2,966 | 7 | T01 | 70.6 | 0.65 | 45.9 | 3,145 | 9 | |
G06 | 10.9 | 3.54 | 38.6 | 2,256 | 3 | T2a | 47.3 | 0.65 | 30.7 | 4,249 | 6 | |
X01 | 74.5 | 4.23 | 315.1 | 3,502 | 11 | T2b | 37.7 | 0.66 | 24.9 | 3,309 | 5 | |
X02 | 34.4 | 4.31 | 148.3 | 2,960 | 5 | T03 | 10.4 | 0.66 | 6.9 | 3,016 | 0 | |
X03 | 11.4 | 4.44 | 50.6 | 2,992 | 3 | *) Estimated personal external dose. | ||||||
Y01 | 89.5 | 4.01 | 358.9 | 791 | 3 | |||||||
Y2a | 46.6 | 4.01 | 186.9 | 3,282 | 13 | |||||||
Y2b | 19.9 | 4.07 | 81.0 | 1,743 | 1 | |||||||
Y03 | 10.8 | 4.19 | 45.3 | 2,395 | 2 |
![]() |
When the frequencies of Dic+cR
were plotted against age (X in year), the regressions were y=0.5717+0.0444X
(R2=0.744) for HBRA and y=0.7227+0.01151X (R2=0.211) for CA. |
1.3. FISH translocation assay |
Blood samples were taken from 6 children and 32 elderly persons in high natural background radiation area (HBRA) 8 children and 25 elderly persons in control area (CA). (One elderly person, HW14, in HBRA is not included because he has medical exposure.) The blood samples were transferred to the cytogenetic laboratory and processed for chromosome aberration analysis within 7 hours after venipuncture. Chromosome painting (FISH) was performed using whole chromosome painting probes for chromosome 1, 2 and 4. The genome equivalent frequency of translocations, FG-Tr, was calculated according to the formula of Lucas et al., Int. J. Radiat. Biol., 62:53-63, 1992. In the earlier reports (Hayata et al. 2000, Zhang et al. 2003), the translocation frequencies have been compared between children and elderly persons, and in the second report (Zhang et al. 2004) the authors discussed on the effects of smoking in elderly persons. Since two data sets have some duplication, the data are combined here. |
References |
Hayata, I., Wang, C., Zhang, W., Chen, D.,
Minamihisamatsu, M., Morishima, H., Yuan, Y., Wei, L. and Sugahara, T.
(2000): Chromosome translocation in residents of the high background radiation
areas in southern China. J. Radiat. Res., 41 (suppl.):69-74. |
Cytogenetic data |
[1] High background radiation area (HBRA) | [2] Control area (CA) | |||||||||||||||||
Subject | Sex | Age | Smoking | Dose/y | Total dose* | Cells | Translocations | Subject | Sex | Age | Smoking | Dose/y | Total dose* | Cells | Translocations | |||
code | (M, F) | (year) | (y/n) | (mGy) | (mGy) | scored | No | FG/1000 | code | (M, F) | (year) | (y/n) | (mGy) | (mGy) | scored | No | FG/1000 | |
YO01 | M | 89.5 | n | 2.92 | 261.3 | 2,233 | 11 | 13.7 | TO01 | M | 70.6 | y | 0.53 | 37.4 | 1,424 | 5 | 9.8 | |
XO01 | M | 74.5 | - | 3.08 | 229.5 | 2,093 | 13 | 17.3 | SO01 | M | 58.7 | - | 0.56 | 32.5 | 653 | 1 | 7.3 | |
HO01 | M | 59 | y | 2.39 | 141.1 | 4,454 | 15 | 9.4 | CO01 | M | 61.2 | y | 0.80 | 49.1 | 3,023 | 19 | 17.5 | |
HO02 | M | 53.3 | y | 2.78 | 148.2 | 5,669 | 18 | 8.8 | CO02 | M | 57.5 | y | 0.65 | 37.2 | 2,208 | 9 | 11.3 | |
HO03 | M | 58.1 | y | 3.18 | 184.5 | 8,375 | 30 | 10.0 | CO03 | M | 57.1 | y | 0.67 | 38.4 | 3,275 | 21 | 17.8 | |
HO04 | M | 53.2 | y | 2.76 | 146.6 | 4,514 | 17 | 10.5 | CO04 | M | 65.3 | y | 0.63 | 41.0 | 1,186 | 6 | 14.1 | |
HO05 | M | 66.2 | y | 2.62 | 173.7 | 2,333 | 6 | 7.1 | CO11 | M | 55.6 | y | 0.65 | 36.1 | 3,345 | 17 | 14.1 | |
HO06 | M | 55.5 | y | 2.97 | 165.0 | 1,145 | 5 | 12.1 | CO12 | M | 63.3 | n | 0.64 | 40.7 | 3,369 | 14 | 11.5 | |
HO07 | M | 61.7 | y | 3.15 | 194.1 | 5,100 | 21 | 11.4 | CO13 | M | 55.3 | - | 0.78 | 43.3 | 4,864 | 20 | 11.4 | |
HO08 | M | 66.3 | n | 2.50 | 166.0 | 5,678 | 38 | 18.6 | CO14 | M | 61.1 | y | 0.68 | 41.3 | 6,282 | 21 | 9.3 | |
HO12 | M | 58.5 | y | 2.65 | 154.9 | 10,079 | 28 | 7.7 | CO16 | M | 59.1 | n | 0.66 | 39.1 | 5,749 | 22 | 10.6 | |
HO13 | M | 55.4 | n | 2.96 | 164.3 | 4,829 | 18 | 10.4 | CW01 | F | 61.2 | n | 0.62 | 38.2 | 2,306 | 9 | 11.0 | |
HO14 | M | 54.6 | y | 2.53 | 137.9 | 1,101 | 8 | 20.2 | CW04 | F | 67.0 | n | 1.10 | 73.6 | 3,519 | 7 | 5.6 | |
HO15 | M | 54.0 | y*** | 2.54 | 137.4 | 1,629 | 7 | 11.9 | CW05 | F | 70.8 | n | 0.75 | 52.9 | 4,666 | 18 | 10.8 | |
HW08 | F | 61.5 | - | 2.82 | 173.2 | 9,736 | 31 | 9.0 | CW06 | F | 68.1 | n | 0.68 | 46.0 | 2,409 | 6 | 7.0 | |
HW14 | F | 69.2 | - | 1.91 | 132.3** | 5,007 | 42 | 23.6 | CW07 | F | 53.0 | n | 0.69 | 36.7 | 2,860 | 9 | 8.8 | |
HW01 | F | 64.3 | n | 2.38 | 153.4 | 2,411 | 7 | 8.2 | CW09 | F | 70.3 | n | 0.71 | 49.7 | 4,138 | 9 | 6.1 | |
HW03 | F | 56.7 | n | 3.29 | 186.5 | 1,598 | 6 | 10.6 | CW10 | F | 61.5 | n | 0.65 | 40.2 | 2,657 | 4 | 4.2 | |
HW04 | F | 58.1 | n | 2.75 | 159.7 | 2,436 | 8 | 9.2 | CW11 | F | 55.5 | n | 0.85 | 47.2 | 5,932 | 10 | 4.7 | |
HW05 | F | 67.8 | n | 2.67 | 181.2 | 1,195 | 2 | 4.7 | CW12 | F | 63.1 | n | 0.70 | 44.0 | 6,157 | 14 | 6.4 | |
HW06 | F | 70.4 | n | 2.79 | 196.4 | 2,552 | 13 | 14.3 | CW13 | F | 65.8 | n | 0.68 | 44.7 | 1,777 | 7 | 11.1 | |
HW07 | F | 55.4 | n | 2.76 | 153.1 | 8,731 | 23 | 7.4 | CW14 | F | 67.3 | n | 0.96 | 64.8 | 2,924 | 14 | 13.5 | |
HW08 | F | 61.5 | n | 2.82 | 173.2 | 9,736 | 31 | 9.0 | CW16 | F | 70.3 | n | 0.77 | 53.9 | 9,633 | 43 | 12.6 | |
HW09 | F | 64.7 | n | 2.6 | 168.4 | 3,290 | 17 | 14.5 | CW17 | F | 65.2 | n | 0.66 | 43.1 | 5,950 | 13 | 6.1 | |
HW10 | F | 69.4 | n | 2.07 | 143.6 | 2,670 | 10 | 10.5 | CW18 | F | 69.3 | n | 0.82 | 56.6 | 3,464 | 6 | 4.9 | |
HW11 | F | 69.3 | n | 2.74 | 189.5 | 2,595 | 27 | 29.3 | TO03 | M | 10.4 | - | 0.54 | 5.6 | 1,742 | 3 | 4.8 | |
HW12 | F | 65.1 | n | 2.84 | 184.6 | 4,047 | 13 | 9.0 | SO03 | M | 10.3 | - | 0.56 | 5.8 | 1,056 | 1 | 2.6 | |
HW13 | F | 68.2 | n | 2.39 | 163.0 | 4,737 | 19 | 11.3 | CC01 | F | 13.8 | - | 0.81 | 11.1 | 8,185 | 17 | 5.8 | |
HW15 | F | 65.3 | n | 2.89 | 188.9 | 6,573 | 33 | 14.1 | CC02 | F | 12.3 | - | 0.69 | 8.5 | 6,886 | 13 | 5.3 | |
HO08 | M | 66.3 | n | 2.5 | 166.0 | 5,678 | 38 | 18.6 | CC03 | M | 12.9 | - | 0.71 | 9.2 | 6,564 | 8 | 3.4 | |
XO13 | M | 74.5 | y | 3.08 | 229.5 | 2,093 | 13 | 17.3 | CC04 | M | 12.9 | - | 0.82 | 10.7 | 3,004 | 0 | 0 | |
YO03 | F | 10.8 | - | 3.02 | 32.6 | 1,015 | 1 | 2.8 | CC05 | M | 12.8 | - | 0.78 | 10.1 | 21,710 | 19 | 2.4 | |
HC01 | M | 12.8 | - | 2.48 | 31.6 | 7,543 | 11 | 4.1 | CC11 | M | 13.0 | - | 0.81 | 10.5 | 7,051 | 4 | 1.6 | |
HC02 | M | 12.1 | - | 2.15 | 25.9 | 10,443 | 16 | 4.3 | *) External dose in FIA kerma. Internal exposure was not considered. | |||||||||
HC03 | M | 13.5 | - | 2.84 | 38.4 | 3,826 | 3 | 2.2 | **) Suspected medical dose is not included. | |||||||||
HC04 | F | 12.8 | - | 3.24 | 41.4 | 9,469 | 18 | 5.3 | ***) Former smoker. | |||||||||
HC05 | F | 12.8 | - | 2.74 | 35.1 | 13,239 | 19 | 4.0 |
![]() |
Results of analysis The authors concluded that, unlike unstable aberrations, no significant difference was found in the frequencies between HBRA and CA while they increased with age. [Commentary]For reference, two types of age dependency of translocations may be quoted here from literature. Curve [A] represents the age dependent increase of translocation frequencies in the unselected populations, in which lifestyle factors, such as smoking, alcohol consumption, chemical or radiation exposure, exposure to coal products are not excluded (Ramsey et al., Mutation Res., 338:95-106, 1995). Curve [B] represents the age dependent increase of in populations in which exposure to such possible genotoxic lifestyle factors are excluded (Tucker et al., Mutation Res., 313:193-202, 1994). [A]: Y=C+8.06×10⁻⁶×age3. [B]: Y=C+3.04×10⁻⁴×age2. C was adjusted to pass through the mean frequencies in children. The transloction frequencies have been determined by FISH painting using the chromosome specific probes for chromosome 1, 2 and 4. |
1.4. Interaction with smoking |
References |
Zhang, W., Wang, C., Chen, D., Minamihisamatsu,
M., Morishima, H., Yuan, Y., Wei, L., Sugahara, T. and Hayata, I. (2004):
Effect of smoking on chromosomes compared with that of radiation in the
residents of a high-background radiation area in China. J. Radiat. Res.,
45:441-446. Zhang, W., Wang, C., Minamihisamatsu, M., Wei, L., Sugahara, T. and Hayata, I. (2008): Effects of smoking on the chromosome aberrations induced by environmental mutagens. In; Taniguchi, K. and Zhang, X. eds., “Advances in Chromosome Sciences”, Vol. 3., pp.59-61. |
![]() |
Results of analysis The interaction between background radiation and smoking was assayed by translocations revealed by HISH painting technology in elderly residents (Table in section 1.3). The effect of smoking was evident in CA, but non-significant in HBRA. The authors concluded that the elevated level of natural radiation in HBRA played a less significant part than smoking in bringing about the induction rate of stable-type aberrations (translocations) in those area. [Commentary]This observation may offer important proposition that the low doses of low LET radiation may interfere with generation of misrejoining when the DNA damage (by smoking) pass through DNA replication of hematopoietic stem cells. Pathway choice in the repair of DNA DSB and its relevance to low doses of low LET radiation. |
1.5. Radioadaptive response? |
Elevated natural background radiation renders the lymphocytes radioresistant? This question was experimentally tested in the peripheral blood lypmphocytes of children.
Peripheral blood was taken from children (12-13 years) living in HBRA (Hele and Shaxin villeges) and CA (Shengzhuli and Xingang villages). The background radiation level was 2.63 mGy/year, 2.45 mGy/year, 0.64 mGy/year and 0.64 mGy/year in Hele, Shaxin, Shengzhuli and Xingang, respectively. The experiments to see radioadaptive response were carried out for 10 children selected from residents of HBRA and 10 from CA. For each child, 2 ml peripheral blood was drown and immediately mixed with 2 ml RPMI 1640 culture medium containing heparin. The blood samples were then irradiated with acute dose of 1.5 Gy gamma-rays, incubated for 2 hours, and then cultured for chromosome preparation.
References |
Comprehensive Report of China-Japan Joint
Research Project “Epidemiological Study in High Background Radiation Area”,
Phase II (from October 1995 through January 1998) to the Radiation Health
Research Foundation, Japan. |
High background radiation area (HBRA): Irradiation with 1.5 Gy gamma-rays in vitro | Control area (CA): Irradiation with 1.5 Gy gamma-rays in vitro | Summary of data | ||||||||||||||||||||
Subject | Cells | No. of | Cells with indicated number of dicentrics | Subject | Cells | No. of | Cells with indicated number of dicentrics | In vitro | Area | Cells | Dicentric aberrations | |||||||||||
code | scored | dics | 0 | 1 | 2 | 3 | 4 | code | scored | dics | 0 | 1 | 2 | 3 | 4 | dose | scored | No. | dics/100 cells | |||
H21 | 400 | 92 | 308 | 70 | 11 | 0 | 0 | H1 | 400 | 136 | 264 | 103 | 15 | 1 | 0 | 0 | CA | 19,800 | 4 | 0.0202 | ||
H22 | 400 | 96 | 304 | 66 | 15 | 0 | 0 | H2 | 400 | 98 | 302 | 78 | 10 | 0 | 0 | HBRA | 24,400 | 5 | 0.0205 | |||
H23 | 400 | 73 | 327 | 55 | 9 | 0 | 0 | H3 | 400 | 99 | 301 | 78 | 9 | 1 | 0 | 1.5 Gy | CA | 4,000 | 1,022 | 25.55* | ||
H24 | 400 | 101 | 299 | 74 | 12 | 1 | 0 | H4 | 400 | 101 | 299 | 80 | 9 | 1 | 0 | HBRA | 4,000 | 872 | 21.80* | |||
H26 | 400 | 73 | 327 | 69 | 2 | 0 | 0 | L5 | 400 | 87 | 313 | 69 | 9 | 0 | 0 | *) p<0.001 | ||||||
H27 | 400 | 69 | 331 | 60 | 3 | 1 | 0 | L7 | 400 | 84 | 316 | 69 | 6 | 1 | 0 | |||||||
H29 | 400 | 83 | 317 | 73 | 5 | 0 | 0 | L8 | 400 | 96 | 304 | 78 | 9 | 0 | 0 | |||||||
H30 | 400 | 119 | 281 | 96 | 10 | 1 | 0 | L9 | 400 | 115 | 285 | 87 | 11 | 2 | 0 | |||||||
H31 | 400 | 97 | 303 | 67 | 12 | 2 | 0 | L10 | 400 | 96 | 304 | 87 | 3 | 1 | 0 | |||||||
H32 | 400 | 69 | 331 | 59 | 5 | 0 | 0 | L11 | 400 | 110 | 290 | 94 | 8 | 0 | 0 | |||||||
. |
![]() |
Commentary The expression of radioadaptive response may be tested by comparing the magnitude of chromosomal response (see, sammary results in the Table above).Alternatively, the changes in the chromosomal susceptibilty may be visualized by the changes in the effective dose profiles (Figures on left). The effective dose is about 10 % reduction in HBRA. But, the profile shows broadening being spreading towards lower doses. This suggests that the lymphocytes are expressing radioadaptive response, but their activity could be heterogeneous. |