| Residents of High Natural Background Radiation Area |
Background radiation in the environment comprises
of variety of sources including both natural and artificial radiation.
Natural background radiation (NBR) is defined as radiation of the non-artificial
sources of apparent origin and sometimes simply referred to as background
radiation (BR) for the environmental interest. Its origin is inhalation
of air (mainly 222Ra), ingestion of food
and water (40K, 14C, etc.), terrestrial radiation from
ground (depending on soil materials), and cosmic radiation (solar and galactic
origin). The levels of natural background radiation vary with location, time
and altitude. The global average effective dose to humans has been estimated to
be 2.40 mSv/year (UNSCEAR Report 2000). This level in Japan is 1.50 mSv/year (http://search.kankyo-housyasen.go.jp).
However, several regions in the world are
known as high background radiation area (here we call HBRA), where the
natural background radiation is far excess of the world average one. They
include Guarapari (Brazil), Kerala (India), Ramsar (Iran) and Yangjiang
(China). Since the exposure levels in these areas are several times (some
tenths of times in particular area) higher than the recommended limit for
exposure to the public from artificial sources (ICRP 2007 Recommendations;
1 mSv that may have a 5.5% chance of developing cancer), the health consequences
of the residents has been continued concern in radioprotection and radiobiological
sciences.
Scenario:
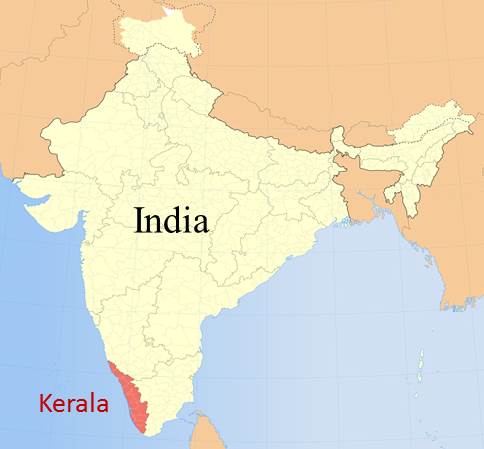
Kerala is a southwest Indian state facing on the Arabian Sea. It coastal
belt, about 0.5 km width and about 250 km long areas spanning from Neendakara
in Kollam district to Purakkad in Alappuzha district is known as world
highest level of natural radioactivity among densely populated areas.
The high level of natural radiation
area (HLNRA) is due to local abundance of monazite, a mineral containing
high concentration (weight average of 8-10.5 %) of thorium phosphate (232ThPO2). The residents are exposed to radiation released
by its decay and decay products externally (gamma- and beta-rays emitted in the
232Th series) and/or internally (dietary and respiratory intake of radionuclides).
Several studies on the frequencies of congenital
malformation (Jaikrishan et al., Radiat. Res., 152:S149-S153, 1999), Down
syndrome (Kochupillai et al., Nature, 262:60-61, 1976; Sundram, Nature,
267:728, 1977; Edwards and Harnden, Nature, 267:728-729, 1997; Verma et
al., Nature 267:729, 1977) have been done but with no conclusively significant
difference as compared to those in the normal level natural radiation areas
(NLNRA). More recently, the acceleration of germline mutation of mitochondria
DNA has been reported (Foster et al., Proc. Natl. Acad. Sci., 99:13950-13954,
2002).
|
 |
| 3.1. Study populations and dosimetry |
Study populations
A large scale cytogenetic investigations
have been carried out from 1986-2007 for inborn abnormalities and acquired
damage to chromosomes in children. This investigation is unique in that
the study design has primarily focused on a potential effect of high level
natural background radiation on inborn abnormalities of children born to
parents living in areas of high natural background radiation.
The data compiled here are those presented
in the mose recent publication by Ramachandran et al., Int. J. Radiat.
Biol., 89:259-267, 2013). In the course of the same research project, several
interim reports have been also published (e.g., Cheriyan et al., Radiat.
Res., 152:S154-S158, 1999; Das and Karuppasamy, Int. J. Radiat. Biol.,
85:272-280, 2009; Das et al., Int. J. Radiat. Biol., 88:642-647, 2012;
Jaikrishan, et al., Indian J. Community Genet., 4:21-31, 2013)
The
umbilical cord blood was collected from 27,295
consecutive newborns at the four Government hospitals (17,298 from HLNBRA and
9,997 from NLNBRA). The chromosome preparations were screened (1) for karyotype
abnormalities with the G-banding confirmation, and (2) for types and
frequencies of chromosome structural aberrations.
Dosimetry
The
dosimetric profiling of the study area was carried out by dividing the area
into small meshes of 100 m2. The ambient dose of each mesh at 1 m
above ground was estimated by means of several Geiger-Muller-based
environmental radiation dosimeters. Since the normal background areas of Kollam
district is 1.2 mGy/y (range <1.0 to 1.5 mGy/y), the areas with radiation
exposure below 1.5 mGy/y were considered as NLNRA and those above 1.5 mGy/y were
considered as HLNRA.
References
Ramachandran,
E. N., Karuppasamy, C. V., Cheriyan, V. D., Soren, D. C., Das, B., Anilkumar,
V., Koya, P. K. M. and Seshadri, M. (2013): Cytogenetic studies on newborns
from high and normal level natural radiation areas of Kerala in southwest coast
of India. Int. J. Radiat. Biol., 89:259-267.
|
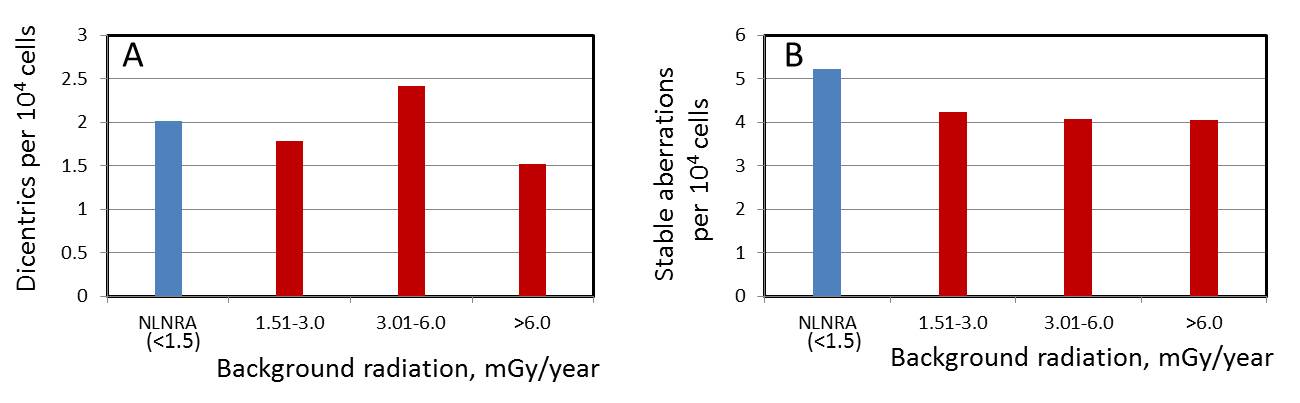
3.2. Chromosome structural aberrations
|
| Background radiation* |
No. of |
Co. of cells |
Dicentrics** |
Stable aberrations** |
Total aberrations*** |
| (mGy/year) |
newborms |
scored |
n |
(F±SE)×10-4 |
n |
(F±SE)×10-4 |
n |
(F±SE)×10-4 |
| <1.50 |
9,997 |
303,398 |
61 |
2.01±0.26 |
158 |
5.21±0.41 |
282 |
9.29±0.55 |
| 1.51-3.0 |
9,533 |
589,214 |
105 |
1.78±0.17 |
250 |
4.24±0.27 |
486 |
8.25±0.37 |
| 3.01-6.0 |
5,121 |
236,720 |
57 |
2.41±0.32 |
96 |
4.06±0.54 |
206 |
8.70±0.61 |
| &rt;6.0 |
2,644 |
138,456 |
21 |
1.52±0.33 |
56 |
4.04±0.54 |
110 |
7.94±0.76 |
| *) Radiation level at resident of parents. The radiation level below 1.50
mGy/year was regarded as NLNRA. Dose groups &rt;1.51 mGy/year are denoted
as HLNRA. |
| **) Aberrations in number (n) and frequency (F) with standard error (SR). Stable aberrations include translocations and inversions. |
| ***) Total aberrations include dicentrics, rings, stable aberrations, fragments and minutes. |
| 3.3. Karyotype abnormalities |
| Background radiation* |
No. of |
Aneuploidy |
Structural abnormalities |
|
Maternal age at birth |
No. of |
Aneuploidy** |
Structural abnormalities |
| (mGy/year) |
newborms |
n |
(F±SE)×10-3 |
n |
(F±SE)×10-3 |
|
(year) |
newborms |
n |
(F±SE)×10-3 |
n |
(F±SE)×10-3 |
| <1.50 |
9,997 |
67 |
6.70±0.82 |
32 |
3.20±0.57 |
|
15-19 |
2,185 |
7 |
3.20±1.21 |
5 |
2.29±1.02 |
| 1.51-3.0 |
9,533 |
50 |
5.23±0.74 |
24 |
2.52±0.51 |
|
20-24 |
15,529 |
42 |
2.70±0.42 |
41 |
2.64±0.41 |
| 3.01-6.0 |
5,121 |
31 |
6.05±1.09 |
12 |
2.34±0.68 |
|
25-29 |
7,953 |
31 |
3.90±0.70 |
20 |
2.52±0.56 |
| &rt;6.0 |
2,644 |
14 |
5.30±1.42 |
4 |
1.51±0.76 |
|
≥30 |
1,628 |
10 |
6.14±1.92 |
6 |
3.69±1.51 |
| *) Dose levels are background radiation at parental residents. Dose group below 1.5 mGy/y denoted as NLNRA. |
|
**) Numerical karyotype anormaly. |
This study also included the frequencies
of inborn abnormalities and answered on the earlier question on the elevated
levels of Down syndrome. After comprehensive studies including background
radiation levels and parental age effects, the authors concluded that there
was no significant difference in the inborn abnormalities, including Down
syndrome, between two levels of natural background radiation areas, and
from newborn abnormalities in other nations as well. Since the authors
did not find any difference in the frequencies of inborn abnormalities
between two areas, the data on inborn abnormalities were combined and presented
in conjunction with other population studies on [inborn errors].