| Induction of Translocations in Spermatogonial Stem Cells |
| [3] Dose-response kinetics (Commentary) Curve fitting by survaillance model (Eq-2) (Sasaki 2006) |
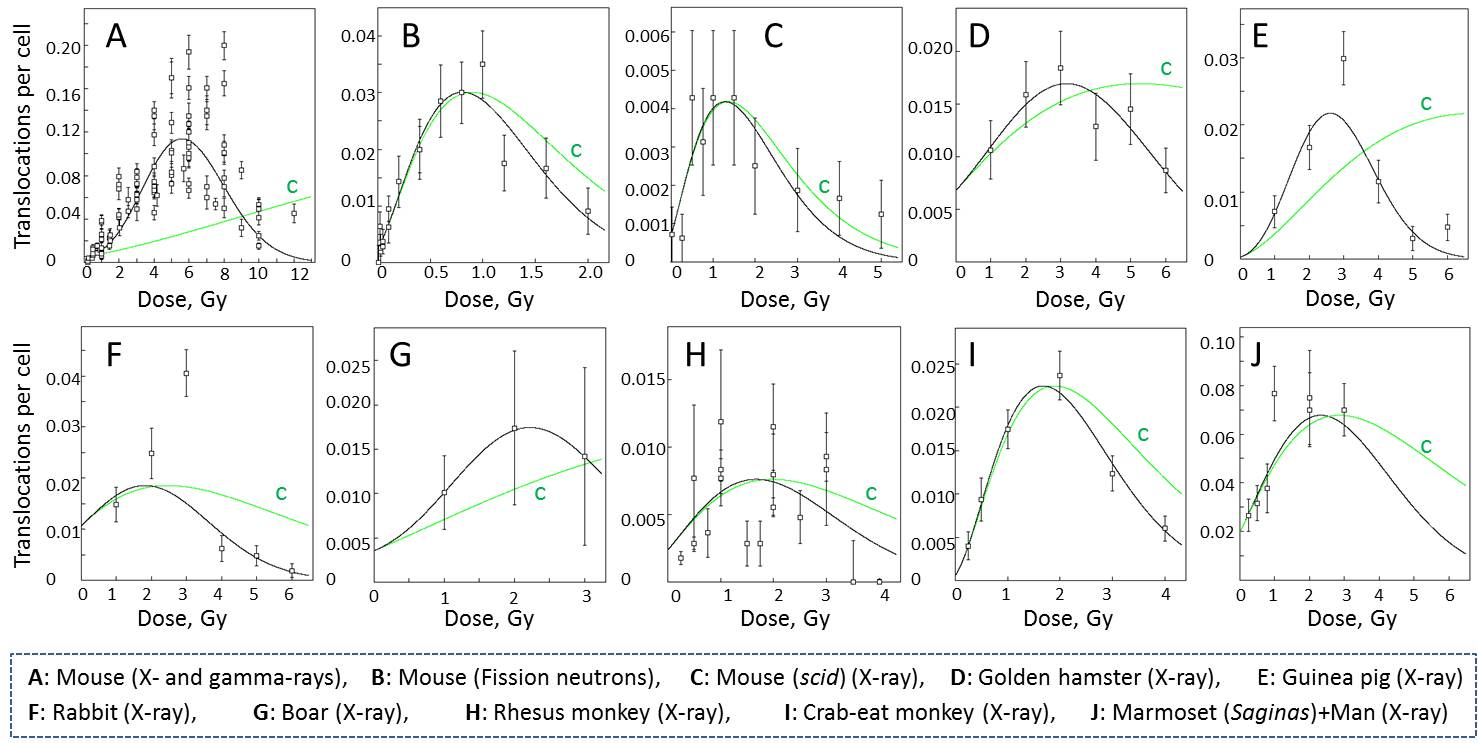
The induction by radiation of translocation in spermatogonial stem cells have been extensively studied in various species of mammals including man because they could be transmitted to offspring and successive generations causing chromosomally abnormal children (hereditary effects). The chromosome translocation induced in spermatogonial stem cells can be recognized as ring-of-IVor chain-of-III (quadraplo-chromosomes) when they pass through meiotic processes to arrive at metaphase I, M-I cells. The translocations identified at M-I cells show a unique dose-response relationship, i.e., a humped dose-response curve, in which the frequencies first increase with the increase of dose, reaching maximum and then decrease with further increase of dose. When the dose is given in fractions or with low dose-rate, this hump is delayed.
The reason of this unique dose-response curve is not clear. A possibility has been discussed in favor of the possible presence of two types of spermatogonial stem cells; one radiation sensitive and another resistant fraction both in terms of chromosome aberration induction and cell killing (Leanhouts, H. P. and Chadwick, K. H., Mutation Res., 82:305-321, 1981) (Eq-1).

The model assumes that the DNA DSBs are the primary lesions leading to chromosome translocations and cell killing and are produced as a function of dose NS=αSD+βSD2 and NR=αRD+βRD2, in the radiosensitive (ν) and radioresistant (1-ν) fraction of cells. θ and λ are the biological determinants for DSBs to develop into chromosome translocations and cell killing, respectively. The model adequately explains the humped curve in mouse data when the parameters are empirically adjusted. The model cannot be applied to the data of man and scid mice (Catanach, B. M. and Kirk, M. J., Mutation Res., 176:69-79, 1987; van Buul, P. P. W. and van Duyn-Goedhart, A., Mutation Res., 350:359-362, 1996).
Recently, an alternative mechanism has been proposed (Sasaki, M. S., J. Radiat. Res., 47(supplement B):B45-B56, 2006) (Eq-2). The rationale of the hypothesis, called surveillance model, is that, as evidenced in the infertile men with de novo translocations, the newly formed translocations are strongly suppressed in passing through meiotic processes to reach diakinesis/metaphase I. Assuming that the surveillance, or meiotic checkpoint, is proportional to the number of translocations, the probability of the translocations to arrive successfully at meiosis I stage, p(Tr), is expressed by

in
which m is the induction rate of
translocations in spermatogonial stem cells as expressed by m=C+αD+βD2.
C is spontaneous frequency and κ is the surveillance parameter operating
against translocation. The model has been fitted by iteratively reweighted
maximum likelihood method. The mathematical model reasonably explains all
the data available in literatures (see above figures). The parameters of
the best fit are shown below. The curve “c” is the predicted response curve
for low dose-rate irradiation, in which the primary induction rate is set
to m=C+αD.
| Animals | Radiation | Parameters of the best fit | ||||||||||||
| C | α/cGy | β/cGy2 | κ | var(C ) | var(α) | var(β) | var(κ) | cov(C,α) | cov(C,κ) | cov(α,β) | cov(α,κ) | cov(β,κ) | ||
| Mose | X-ray | (1.861±0.094)×10-1 | (5.356±0.969)×10-4 | (5.500±0)×10-6 | (1.746±0.087)×10-1 | 8.745×10⁻⁵ | 9.382×10⁻⁹ | 2.298×10⁻²⁵ | 7.448×10⁻⁵ | -5.527×10⁻⁷ | 1.882×10⁻²¹ | 5.331×10⁻²⁴ | -1.941×10⁻⁷ | 0 |
| Mouse | Fission netron | (2.354±1.412)×10-1 | (2.023±0.421)×10-2 | (2.860±1.911)×10-5 | (1.746±0.087)×10-1 | 1.995×10⁻² | 1.770×10⁻⁵ | 3.653×10⁻¹⁰ | 4.668×10⁻⁵ | -4.700×10⁻⁴ | 9.615×10⁻⁷ | -6.344×10⁻⁸ | -5.295×10⁻⁶ | 7.629×10⁻⁸ |
| Mouse (scid) | X-ray | (3.638±0.961)×10-1 | (1.212±0.093)×10-2 | (5.500±0.012)×10-6 | (7.678±0.486)×10-3 | 9.237×10⁻³ | 8.648×10⁻⁷ | 0 | 2.361×10⁻⁷ | -4.981×10⁻⁵ | 0 | 0 | 3.209×10⁻⁷ | 0 |
| Golden hamster | X-ray | (6.527±2.129)×10-1 | (2.620±1.017)×10-3 | (5.500±1.343)×10-6 | (3.023±0.259)×10-2 | 4.530×10⁻² | 1.034×10⁻⁶ | 1.804×10⁻¹² | 6.709×10⁻⁶ | -1.173×10⁻⁴ | 1.196×10⁻⁸ | -1.157×10⁻⁹ | 1.279×10⁻⁶ | -1.565×10⁻¹⁰ |
| Guinea pig | X-ray | (9.164±47.085)×10-2 | (2.853±4.788)×10-3 | (1.775±1.034)×10-5 | (3.868±2.313)×10-2 | 2.217×10⁻¹ | 2.293×10⁻⁵ | 1.069×10⁻¹⁰ | 5.348×10⁻⁴ | -1.559×10⁻³ | 1.547×10⁻⁶ | -4.303×10⁻⁸ | -2.630×10⁻⁵ | 1.472×10⁻⁷ |
| Rabbit | X-ray | (8.706±12.579)×10-1 | (4.728±5.136)×10-3 | (9.233±12.252)×10-6 | (3.319±5.868)×10-2 | 1.582×100 | 2.638×10⁻⁵ | 1.501×10⁻¹⁰ | 3.443×10⁻³ | -9.577×10⁻⁴ | -8.544×10⁻⁶ | -4.546×10⁻⁸ | -5.312×10⁻⁵ | 5.296×10⁻⁷ |
| Boar | X-ray | (4.130±1.892)×10-1 | (2.454±2.209)×10-3 | (2.182±0.492)×10-5 | (3.129±0.966)×10-2 | 3.579×10⁻² | 4.879×10⁻⁶ | 2.418×10⁻¹¹ | 9.339×10⁻⁵ | -3.399×10⁻⁴ | -6.077×10⁻⁷ | 4.135×10⁻⁹ | -1.940×10⁻⁵ | -2.787×10⁻⁸ |
| Rhesus monkey | X-ray | (5.384±11.159)×10-1 | (7.461±12.109)×10-3 | (8.163±99.381)×10-6 | (1.392±2.192)×10-2 | 1.245×100 | 1.466×10⁻⁴ | 9.897×10⁻⁹ | 4.803×10⁻⁴ | -9.837×10⁻³ | -7.545×10⁻⁵ | 1.281×10⁻⁷ | -2.251×10⁻⁵ | 9.658×10⁻⁷ |
| Crab eat monkey | X-ray | (1.296±0.949)×10-1 | (1.005±0.159)×10-2 | (8.021±3.163)×10-6 | (3.992±0.812)×10-2 | 9.000×10⁻³ | 2.306×10⁻⁶ | 1.000×10⁻¹¹ | 6.592×10⁻⁵ | -9.060×10⁻⁵ | 4.331×10⁻⁸ | -3.116×10⁻⁹ | 6.388×10⁻⁶ | 3.746×10⁻⁹ |
| Marmoset* | X-ray | (2.124±3.460)×10-1 | (1.419±0.698)×10-2 | (1.431±4.054)×10-5 | (2.185±0.861)×10-2 | 1.196×10⁻¹ | 4.869×10⁻⁵ | 1.643×10⁻⁹ | 7.409×10⁻⁵ | -2.113×10⁻⁴ | -2.963×10⁻⁶ | -2.550×10⁻⁷ | -2.189×10⁻⁵ | 2.282×10⁻⁷ |
| Marmoset** | X-ray | (3.625±1.233)×10-1 | (8.637±3.763)×10-3 | (5.500±17.423)×10-6 | (1.354±0.353)×10-1 | 1.520×10⁻² | 1.416×10⁻⁵ | 3.035×10⁻¹⁰ | 1.242×10⁻³ | -3.363×10⁻⁴ | 9.498×10⁻⁷ | -5.876×10⁻⁸ | -9.414×10⁻⁵ | 5.340×10⁻⁷ |
| Marmoset**+man | X-ray | (5.426±0.767)×10-1 | (5.531±1.258)×10-3 | (5.500±1.247)×10-6 | 1.116±0.179)×10-1 | 5.885×10⁻³ | 1.583×1065 | 1.555×10⁻¹² | 3.211×10⁻⁴ | -7.829×10⁻⁵ | 2.024×10⁻⁸ | -7.868×10⁻¹⁰ | 1.629×10⁻⁵ | 6.357×10⁻¹⁰ |
| * Marmoset: Callithrix jacchus, **) Marmoset: Saguinas fussicollis illgeri and Saguinas oedipus oedipus | ||||||||||||||