Techa River: Nuclear disaster along the Techa River (Southern Urals, Russia)

Scenario 

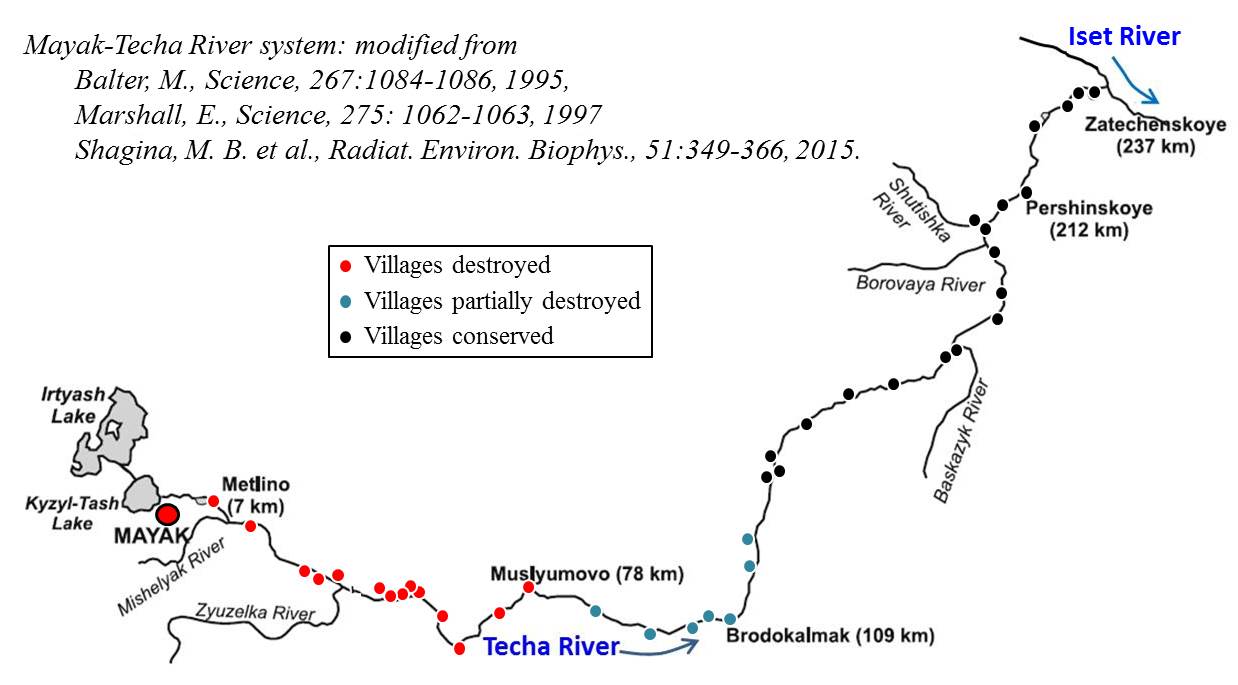
      The nuclear-industrial complex known as Mayak Production Association (PMA) was constructed in May 1946 in the province of Cheryabinsk (Southern Urals). MPA was comprised of a radiochemical separation plant (Facility B), isotope plants and uranium-graphite reactors (Facility A), and started the production of weapon-grade plutonium in 1948. The drainage of the area is primarily via Techa River (237 km length). The radiation exposures to the inhabitants alongside the Techa River were in complex pictures.

     (1) Discharge of radioactive wastes: While natural lakes and dammed ponds at the plant site were employed as reservoirs to manage radioactive effluents, direct discharges of large amount of radionuclides to the Techa River system occurred between 1949 and 1956; approximately 98% of the total radioactivity being released during 1949-1951. For instance, over 100 PBq of radioactive material was discharged during the whole period, causing severe contamination down the entire length of the Techa River. Of the total activity, ruthenium isotopes (103Ru, 106Ru) account for over 50% and estimated 12 PBq of 90Sr, 13 PBq of 137Cs, and alpha emitters (Pu and U isotopes) of 2 TBq were discharged during 1949-1957. The Techa River system was only water source for the residents of the riverside villages. A total of 124,000 people received external exposure from 137Cs, 106Ru, 95Zr and other radionuclides, and internal exposure from ingestion of 89Sr, 90Sr and 137Cs as well. It has been estimated that about 8% of this population received doses higher than 1 Gy.
     (2) Redistribution of radionuclides by flood: An extrardinary flood in April 1951 resulted in substantial contamination of floodplain soil, which continued to increase through October 1951.

     (3) Explosion of radioactive wastes (Kyshtym accident): On 29 September 1957, a chemical explosion of highly radioactive wastes in 300 m3 tank at the plutonium production center caused approximately 7.4~1016 Bq of nuclear fission products to be dispersed in the atmosphere exposing 270,000 people to radiation. Five years after the accident, the main source of long-term exposure to humans and the environment was predominantly by 90Sr.
     (4) Redistribution of radioactive deposits by wind: Furthermore, in 1967, the radioactive wastes deposited in the slit of the dry bed of the lake Karachay was redistributed by the wind over a wide area previously affected by the 1957 contamination, irradiating about half a million people with 2.2~1013 Bq.

     With these nuclear disasters, a large number of residents of the riverside area have been exposed externally to 137Cs and internally predominantly to 90Sr. In 1952, the discharge of radioactive wastes into the river was prohibited. At the same time, the utilization of river water for living and industry use was prohibited and people were evacuated. (cited from Salassidis et al., Int. J. Radiat. Biol., 74:431-439, 1998; Testa et al., Mutation Res., 401:193-197, 1998).

     Excess cancer occurrence has been noticed in the riverside people as early as in 1960. It called international interest first in 1990, when Japan-USSR binational symposium was held in Tokyo, 25-29 June, 1990 and later in the International Symposium on "Chronic radiation exposure: Risk of late effects", Cheryabinsk, 9-13 January, 1995.
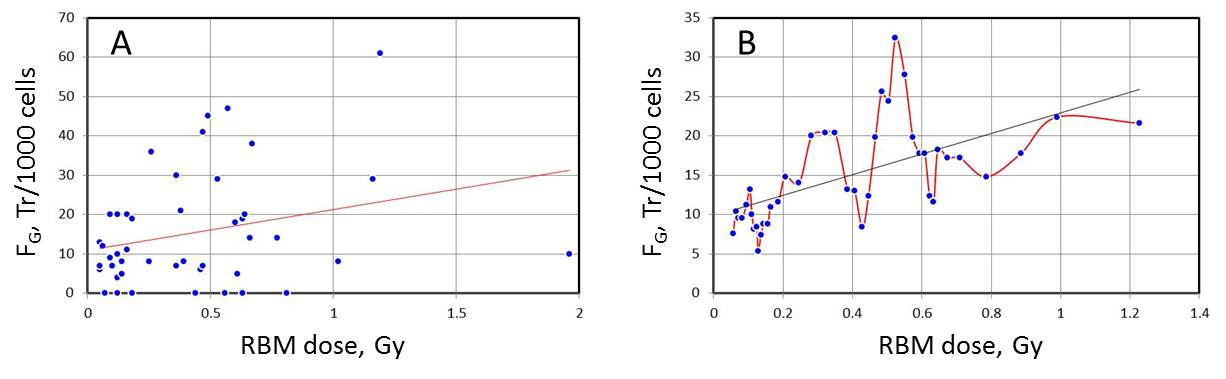
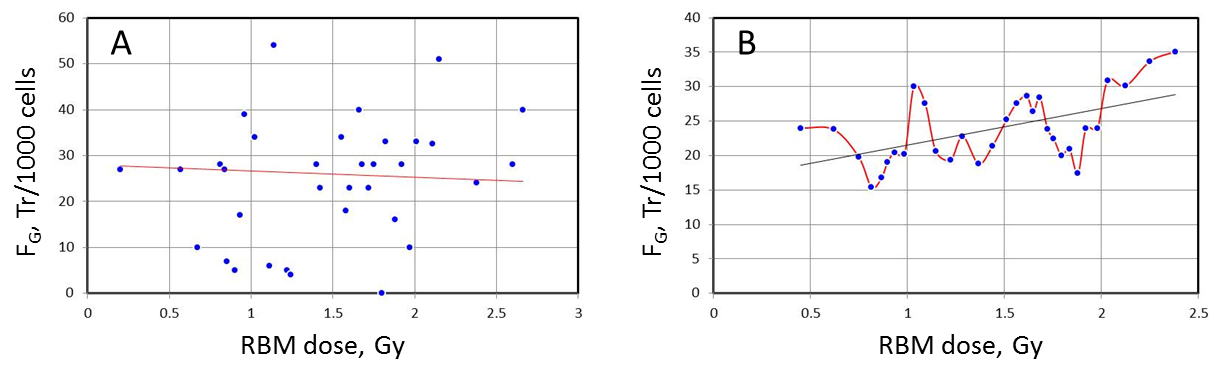
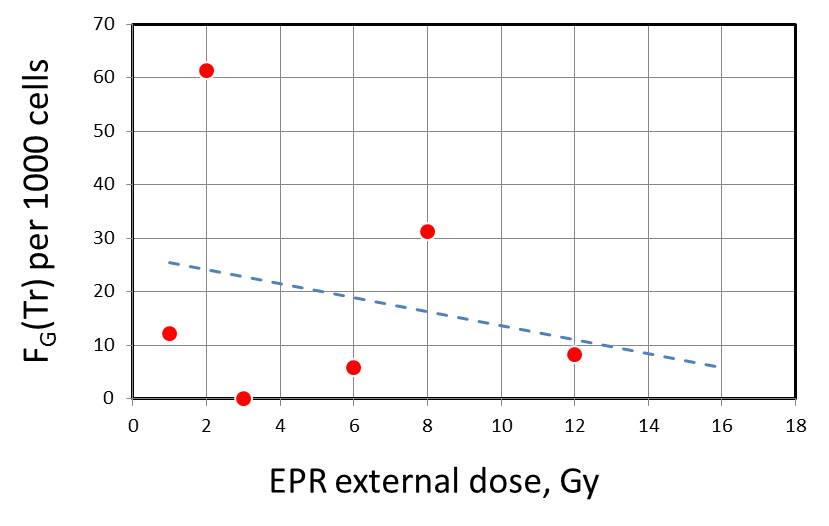
     Several studies have been performed to examine chromosome aberration frequencies in peripheral blood lymphocytes of the residents in the riverside villages of Techa River. Again as in the case of residents in the contaminated areas due to Chernobyl NPS accident and cleanup workers, they are unanimously raised a problem of discrepancy between chromosome-based dose and reconstructed dose, such as no significant elevation of aberration frequencies, absence of dose-response relationship and/or severely suppressed chromosome aberration level as compared to reconstructed physical estimate. 


 [1] Techa River: Inhabitant along the river (Bauchinger et al. 1998)

Chromosome aberration analysis 

     Lymphocyte chromosome analysis was carried out in 73 radiation-exposed residents from villages along the Techa River located 7-148 km downstream the site of discharge of radioactive waste from the plutonium production facility of Mayak. Chromosome aberrations were studied by FISH painting using whole chromosome painting probes of chromosomes 1, 4 and 12. Blood sampling was made during the years between 1994 and 1996. Thirty-nine unexposed persons from non-contaminated areas were used as controls.
     As compared with controls, mean translocation frequencies were significantly higher in the exposed group. Individual translocation frequency in 40 subjects with known whole body counter data and calculated red bone marrow dose below 0.6 Gy was within 95% limits of the calibration curve constructed in vitro. 

Reference

     Bauchinger, M., Salassidis, K., Braselmann, H., Vozilova, A., Pressl, S., Stephan, G., Snigiryova, G., Kozheurov, V. P. an Akleyev, A. (1998): FISH-based analysis of stable translocations in a Techa River population. Int. J. Radiat. Biol., 73:605-612.  

Chromosome aberrations 

Dose evaluation in villages along the Techa River

Village Distance from No. of persons No. of cells Absorbed dose (Gy)
(settlement) the site of release (km) studied scored external (1945-1956) RBM (external+internal, for 25 yrs)
Metlino 7 29 15,252 1.20 1.64
Assanova 33 6 2,681 0.80 1.27
M. Taskino 41 1 281 0.70 1.10
Gerasimovka 43 2 884 0.70 0.98
Nadyrovo 50 1 326 0.40 0.95
Isayevo 60 1 839 0.20 0.59
Muslyumovo 78 10 6,100 <0.10 0.61
Kurmanovo 88 5 1,867 <0.10 0.38
Brodokalmak 109 4 1,907 <0.05 0.14
Panovo 128 1 492 <0.05 0.38
Russkaya Techa 138 8 2,963 <0.05 0.22
Baklanova 141 1 765 <0.05 0.07
N. Petropavlovka 148 4 5,463 <0.05 0.28
.
.Chromosome aberration frequencies as revealed by FISH-painting
Groups/distance No. of persons Year od birth No. of cells FG translocation per 1000
studied (mean}SD) scored (mean}SD
Group I: 7-60 km
I-a 28 1936}10 13,415 16.0}2.7
I-b 12 1938}11 6,848 8.3}2.0
Group II: 78-148 km
II-a 14 1936}7 7,455 6.8
II-b 19 1934}11 8,802 16.5}3.4
Total (Groups I + II) 73 1936}10 36,520 12.8}1.5
Controls 39 1940}11 21,514 5.7}1.0
.

Commentary added at compilation of data 

Figure 1A is reproduced from the scattered plots of FG translocation frequencies presented by the authors for persons from the villages 7-148 km downstream from the waste discharge as plotted against red marrow dose (RBM dose). They concluded that the aberration frequencies were significantly elevated and were within the limits of 95% prediction levels of the in vitro linear dose-response relationship. The dose-dependent increase is more clearly seen when the data are smoothed by moving window averaging, MWA=(w5,s1), as seen in Figure 1B.


[2] Techa River: Inhabitants (Akleyev et al. 1995) 
Chromosome aberration analysis  

     Research was collaborative study between Ural Research Center for Radiation Medicine (URCRM), Chelyabinsk, Russia, and Radiation Effects Research Foundation (RERF), Hiroshima, Japan, was conducted 43 years after the beginning of radioactive waste discharge to Techa River. The study cohort was selected from persons cumulative doses accounting for radionuclides 90Sr and 137Cs in 90-95% of cases. The dose to the red bone marrow (RBM) was reconstructed from the dose rate throughout the follow-up period and the measurement of whole body counter.
     Blood sampling was made for the analysis of stable-type chromosome translocations, glycophorine A (GPA) mutations in erythrocytes and T-cell receptor (TCR) mutations. Chromosome translocations were analyzed by HISH painting technology with whole chromosome DNA probes for chromosomes 1, 2 and 4. Controls were taken from age-matched persons living in Urals.
     The analysis of chromosome translocation frequencies failed to find any significant difference between exposed and control cohorts. No difference was also the case for GPA and TCR mutations.
 

Reference 

     Akleyev, A. V., Kossenko, M. M., Silkina, L. A., Degteva, M. O., Yachmenyov, V. A., Awa, A., Akiyama, M., Veremeyeva, G. A., Vozilova, A. V., Kyoizumi, S., Kozheurov, V. P. and Vyushkova, O. V. (1995): Health effects of radiation incidents in Southern Urals. Stem Cells, 13 (Suppl. 1):58-68. 

Chromosome aberrations 

.
Group Mean cumulative No. of Age No. of FG, Tr/cell
RBM dose (Sv) persons Mean and range cells (Mean}m)
Exposed Group I 0.82 (below 1.0) 8 62.5 (51-73) 4,000 0.021}0.004
Group II 1.51 (1.0-1.99) 19 64.7 (52-82) 9,500 0.024}0.003
Group III 2.38 (2.0 and higher) 7 57.0 (55-59) 3,500 0.032}0.005
Group IV* 1.76 (1.20-2.66) 11 62.2 (54-81) 3,500 0.027}0.004
Total 1.52 (0.28-2.66) 34 62.6 (51-82) 17,000 0.025}0.002
Comparisons (controls)      0 10 65.7 (54-84) 5,000 0.031}0.007
*) Group of persons showing chronic radiation sickness (CRS).
.
Commentary added at compiling the data 

     Figure A is the scattered plots of the translocation frequencies, replotted from Figure 10 of Akleyev et al. 1995, indicating no positive correlation with the RBM dose. Figure B shows the data smoothing by moving window averaging, MWA=(w5s1), of the same data. The dose-response is suggestive. 


[3] Techa River: Children (Testa et al. 1998)
Chromosome aberration analysis 

     Fifteen children born and raised in riverside village Myslyumovo (78 km from the site of radioactive waste discharge) subjected to radioactive contamination over a period of 45 years. They came to Italy for a one-month stay, where they underwent medical check. Blood sampling was carried out to examine chromosome aberrations. Control group consisted of 11 Russian children (10-14 yrs old) from uncontaminated locality of Smolensk (Russia) which had been selected for previous study on the Chernobyl accident (Padovani et al. Mutation Res., 395:249-254, 1997).
     Chromosomes were analyzed in the preparations prepared wit conventional Giemsa staining method. Aberration frequencies, particularly acentric aberrations, were significantly elevated in the Techa River cohort (p<0.05, two-tailed Mann-Whitney U test). 

Reference

     Testa, A., Padovani, L., Mauro, F., Appolloni, M., Anzidei, P. and Stronati, L. (1998): Cytogenetic study on children living in Southern Urals contaminated areas (nuclear incidents 1948-1967). Mutation Res., 401:193-197. 

Chromosome aberrations  
.
Subject Sex Age No. of Chromosome aberrations Subject Sex Age No. of Chromosome aberrations
(yrs) cells Dic+cR Ace* (yrs) cells Dic+cR Ace*
1 M 11 600 0 3 9 M 11 600 0 5
2 M 11 650 0 4 10 F 11 600 0 3
3 M 11 281 0 0 11 F 10 325 1 4
4 F 10 600 0 1 12 F 11 600 0 3
5 M 11 581 1 3 13 M 10 600 0 3
6 F 10 750 2 4 14 M 9 600 0 5
7 F 11 600 0 1 15 F 10 600 1 2
8 M 9 592 1 1
*) Excess acentrics: include acentric rings, minutes and fragments .


[4] Techa River: Residents living upper reach (Degteva et al. 2005, 2015; Vozilova et al. 2012) 
Report-1 

     Degteva, M. O., Anspaugh, L. R., Akleyev, A. V., Jacob, P., Ivanov, D. V., Wieser, A., Vorobiova, M. I., Shishkina, E. A., Shved, V. A., Vozilova, A., Bayanskin, S. N. and Napier, B. A. (2005): Electron paramagnetic resonance and fluorescence in situ hybridization-based investigations of individual doses for persons living at Metlino in the upper reaches of the Techa river. Health Phys., 88:139-153. 

Study design 

     External dose was estimated by electron paramagnetic resonance (EPR) on teeth enamel obtained from 16 exposed donors born between 1928 and 1952 in Metlino (7 km from the release site). Metllino is the closest village to the site of release. The residents were exposed both externally to gamma-rays from the contaminated river bank and internally from dietary intake of radionuclides (89/90Sr). In the residents of Metlino, the external dose is estimated to contribute up to 45% of the total red bone marrow dose. In this study, a total of 36 EPR measurements were performed; 13 at the Institute for radiation protection, GSF-National Research Center for Environment and Health, Munich, Germany (GSF), and 20 at the Institute of Medical Physics, Ekaterinburg, Russia (IMP). The inter laboratory comparison of EPR dosimetry systems was made on the same samples obtained from Ural donors. 

Chromosome analysis 

     Chromosome analysis was carried out on peripheral lymphocytes from 31 exposed persons (residents of Metlino born between 1918 and 1953). Blood samples were collected between 1994 and 1998. Lymphocyte culture and chromosome preparation were made at the Urals Research Center for Radiation Medicine (URCRM), and FISH analysis was performed at GSF. Whole chromosome-painting probes for chromosomes 1, 4 and 12 were used together with pancentromeric probe. 

Chromosome translocations and EPA measures of external dose (c.f., Genome equivalent frequencies, FG(Tr), were calculated and shown in figure at the time of data compiling.) 

 
Subject ID EPA dose* No. cells No. of FG(Tr)
Gy scored Tr** (~10-3)
470 0.25 519 2 12.22
1154 0.95 155 3 61.33
1836 (0.47) 500 0 0
4235 0.08
4531 0.44
4759 0.82 554 1 5.82
6903 (0.76)
7411 (0.72) 305 3 31.18
8092 0.57
8451 0.29
10247 0.73
11317 13.5 432 1 8.37
12460 0.51
18255 2.35
19287 0.21
20436 0.05
*) EPA: electron paramegnetic resonance
Measuremet made at GFS-National Research Center for Environmental Health, Munich, Germany.
Others (in paretheses) were made at Institute of Medical Physics, Ekaterinburg, Russia.
**) Tr: translocation


Report-2 
     Degteva, M. O., Shagina, N. B., Shiskina, E. A., Vozilova, A. V., Volchkova, A. Y., Vorobiova, M. I., Wieser, A., Fattibene, P., Della Monnaca, S., Ainsury, E., Moquet, J., Anspaugh, L. R. and Napier, B. A. (2015): Analysis of EPR and FISH studies of radiation doses in persons who lived in the uppr reaches of the Techa River. Radiat. Environ. Biophys., 54:433-444.  
Chromosome analysis 
     Blood sampling was conducted in 2009-2013 for the residents of upper reach of the Techa River. Lymphocyte translocation frequencies (stable-type) were studied by FISH painting method. The frequencies were compared with the estimated external doses and the dose to the tooth enamel evaluated by electron paramagnetic resonance (EPR) assay. Basically there was a reasonable agreement among chromosomally estimated dose, external dose and EPR dose.  
Chromosome aberration  
.
Group Settlement Distance from No. of External dose of EPR-based dose* GE cells** No. of
release site (km) persons reference person (mGy) (mGy) scored translocations
I Metlono 7 23 400-600 547}170 22,147 556
II Techa Brod, Asanovo, Nazarovo, 18-45 13 150-400 223}83 9,358 204
Maloe Taskino, Gerasimovka, GRP
II Nadyrov Most, Nadyrovo 48-50 12 100-200 569}250 9,177 273
IV Ibragimov, Isaevo, PHT 54-70 34 80-120 160}60 16,248 333
*) To evaluate EPR-based dose to enamel, the anthropogenic dose was modified by the 90Sr concentration-to-dose converstion factors for different tooth positions.
**) Genome-equivalent cells scored.
.


Report-3 

     Vozilova, A. V., Shagina, N. B., Degteva, M. O., Anisbury, E. A., Moquet, J. E., Hone, P., Lloyd, D. C., Fominar, J. N. and Darroudi, F. (2012): Preliminary FISH-based assessment of external dose for residents exposed on the Techa river. Radiat. Res., 177:84-91.

Chromosome analysis 

     Blood samples were collected from 18 persons residing in middle Techa regions, and translocation frequencies were studied by FISH paining method three laboratories; Urals Research Center for Radiation Medicine (URCRM), Health Protection Agency (HPA), UK, and Leiden University Medical Center (LUMC).
    The residents were exposed predominantly to the internal doses from ingestion of radionuclides (mostly 90Sr) in river water and local foodstuffs. Contribution of external exposure and internal exposure to non-strontium radionuclides to the red bone marrow (RBM) dose was less than 5 %.

Chromosome aberration
     A weak, but significant linear dependency to the RBM 89/90Sr dose. The dose to the individual subject was not given in the report. (Figure is reproduced from Fig. 1 of Vozilova et al., 2012).