| Sellafield Nuclear Processing Plant, U. K. |
|
Scenario |
|
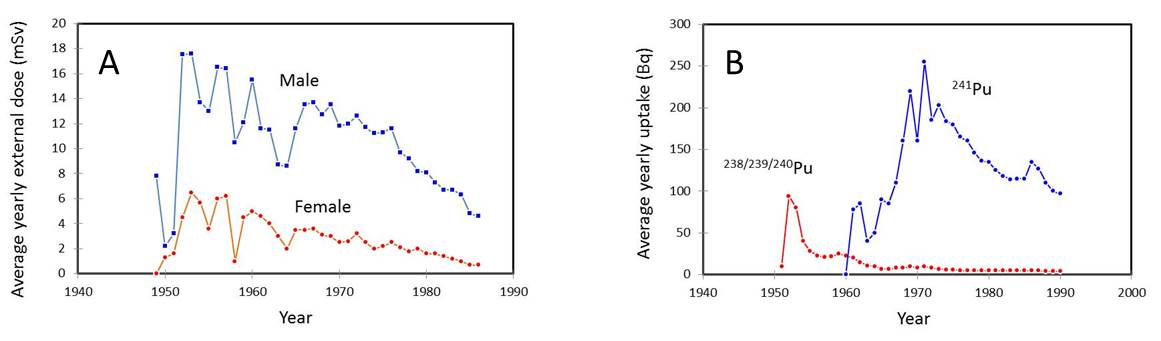
Sellafield nuclear processing plant, on the Cumbrian coast in UK, was constructed in 1942 and commenced in September 1947, originally for the production of weapon grade plutonium, and later operating as a decommission and reprocessing plant which separate uranium, plutonium and fission products from spent nuclear fuel from commercial reactors. The workers are potentially at risk for the exposure to radiation either externally from the radioactive wastes (mostly gamma-rays) or internally by inhalation of radioisotopes (mostly plutonium). The external dose has been monitored by dosimeters (e.g., film badge) for workers in area of the plant in which radioactive materials were present. The uptake of plutonium was estimated principally in urine samples. For the plutonium, there are two ways of exposure; one is alpha-emitting isotopes (238/239/240Pu, in which 239Pu is a major component) and anther is 241Pu which decays by beta particle emission to the alpha-emitting 241Am. For example, the followings are the annual levels of (A) average external radiation and (B) average uptake of plutonium studied for cancer risk in over 14,000 workers employed during 1947-1975. Among all radiation workers, approximately 50% are plutonium workers, in which 89% have been assessed for plutonium dose. ([A], Douglas, A. J. et al., Br. J. Cancer, 70:1232-1243, 1994; [B], Omar, R. Z. et al., Br. J. Cancer, 79:1288-1301, 1999). |
| Sellafield plutonium workers [1] (G-band analysis; Tawn et al. 1985) |
| Chromosome aberration analysis |
|
Blood samples were obtained from 54 plutonium workers. According to the plutonium body burden as measured by urine analysis, they were divided into three groups. Lymphocyte chromosome aberrations were analyzed by G-banding method. As a result, it was suggested that significant deposition of plutonium do cause an increase in chromosome aberrations. |
| Reference |
|
Tawn, E. J., Hall, J. W. and Schofield, G. B. (1985): Chromosome studies in plutonium workers. Int. J. Radiat. Biol., 47:599-610. |
| Results of analysis |
| Group | No. of | Age | Average Pu | Average | No. of | Chromosome aberrations | Aberrations per 1000 cells | Distribution of cells with | |||||||||||||||||||
| subjects | average | body burden | external | cells | Cs- | Cu- | Term | Dics | cR | aR | Inter | Tr | Com- | Total | Asymetric | Adjusted | Symmmetric | Acentrics | indicated number of exchange aberrations | ||||||||
| (range) | (Bq) | dose (Sv) | cells | cells | cells | del | del | plex | exchanges | exchanges | asymmetrics | exchange | 0 | 1 | 2 | 3 | 4 | 5 | 6 | 7 | |||||||
| 1 | 39 | 33.7(21-62) | 0 | - | 1,950 | 8 | 8 | 6 | - | - | - | - | 9 | - | 6.67±1.85 | 1.03±0.73 | 1.03 | 5.64±1.70 | 3.07±1.26 | 1,937 | 13 | - | - | - | - | - | - |
| 2 | 27 | 51.3(40-61) | 296-740 | 0.545 | 2,700 | 30 | 23 | 14 | 1 | 1 | - | 1 | 26 | 6 | 24.82±3.03 | 6.30±1.53 | 4.8 | 18.52±2.62 | 5.18±1.28 | 2,656 | 35 | 5 | 1 | - | - | 2 | 1 |
| 3 | 17 | 52.0(33-62) | 740-1480 | 0.284 | 1,700 | 14 | 17 | 8 | 1 | 1 | 1 | - | 16 | 2 | 17.06±3.17 | 6.74±1.95 | 5.99 | 10.59±2.50 | 4.71±1.66 | 1,677 | 19 | 2 | 2 | - | - | - | - |
| 4 | 10 | 51.0(38-58) | &rt;1480 | 0.29 | 1,000 | 9 | 8 | 4 | 2 | 2 | - | - | 11 | 2 | 25.00±5.00 | 11.00±3.32 | 10.78 | 14.00±3.74 | 4.00±2.00 | 986 | 10 | 2 | - | - | 1 | 1 | - |
| Sellafield plutonium workers [2] (G-band analysis; Whitehouse et al., 1998) |
|
Chromosome aberration analysis |
|
Chromosome aberration analysis in peripheral blood lymphocytes was carried out using G-banding method. Two groups of plutonium workers were selected depending on their plutonium levels; one with 20-50% maximum permissible body burden (MPBB) and another with higher than 50% MPBB. Each group was compared with age-matched workers with comparable level of external dose alone (external dose controls) and workers with neither plutonium nor external dose (unexposed controls). Blood samples were obtained between February 1988 and October 1991 (except for one case sampled in 1986). |
| Reference |
|
Whitehouse, C. A., Tawn, E. J. and Riddell, A. E. (1998): Chromosome aberrations in radiation workers with internal deposits of plutonium. Radiat. Res., 150:459-468. |
|
Observations: Significant elevation of translocations was found for plutonium workers and external dose controls as compared with the unexposed controls. |
| Study group* | No. of | Mean age | Mean external | No. of | Chromosome aberrations | Frequency per 1000 cell | |||||||||||
| subjects | years (range) | dose, mSv | cells | Dic+ring | Int del | Transloc | Inv | complex | Ter del | xAce | Sym Exchange | Asymm exchange | Acentrics | ||||
| Group I (20-50% of MPBB) | Plutonium workers | 15 | 56 (45-63) | 530 (169-783) | 1,500 | 4 | 2 | 31 | 7 | 3 | 1 | 3 | 29.33±4.24 | 5.33±1.89 | 2.67±1.33 | ||
| External dose controls | 15 | 56 (47-61) | 540 (183-819) | 1,500 | 2 | 1 | 14 | 9 | 0 | 6 | 11 | 15.33±3.20 | 2.00±1.15 | 11.33±2.75 | |||
| Unexposed controls | 15 | 57 (43-64) | 9 (0-28) | 1,500 | 2 | 0 | 15 | 2 | 1 | 3 | 0 | 12.67±2.91 | 1.33±0.94 | 2.00±1.15 | |||
| Group II (&rt;50% MPBB) | Plutonium workers | 9 | 55 (42-63) | 250 (39-500) | 900 | 3 | 0 | 14 | 7 | 3 | 5 | 2 | 30.00±5.77 | 3.33±1.92 | 7.78±2.94 | ||
| External dose controls | 9 | 55 (39-64) | 238 (38-471) | 797 | 4 | 1 | 13 | 0 | 2 | 0 | 0 | 21.33±5.17 | 6.27±2.81 | 0 | |||
| Unexposed controls | 9 | 54 (41-63) | 7 (0-12) | 900 | 2 | 1 | 8 | 2 | 1 | 4 | 0 | 11.11±3.51 | 3.33±1.92 | 4.44±2.22 | |||
| *) Two study groups were prepared according to Pu body burden, one for Pu worjkers with 20-50% of the maximum permissible body burden (MPBB, i.e., 740 Bq) and another for higher than MPBB. These Pu workers were compared with age-matched | |||||||||||||||||
| non-Pu workers minly exposed to external radiation (gamma-rays) at comparable external radiation doses, and unexposed controls with negligible occupational radiation exposures. | . | ||||||||||||||||
| Sellafield plutonium workers [3] (G-band analysis; Tawn and Whitehouse, 2005; Whitehouse and Tawn, 2001) |
| Chromosome aberration analysis |
| Selection of workers and G-band analysis were the same as described previously (Whitehouse, C. A. et al., Radiat. Res., 150:459-468, 1998). Blood samplings were obtained during the periods 1978-1982, 1986-1991, 1993-1994 and 1998. The plutonium workers were selected according to their red bone marrow (RBM) dose because RBM dose became available since then. Twenty plutonium workers with RBM dose of higher than 60 mSv (range 65-533 mSv) were compared with the age-matched external dose controls and unexposed controls. The present study groups also include the subjects dealt with in the previous paper (samples between 1978-1982). |
| Reference |
|
Tawn, E. J. and Whitehouse, C. A. (2005):
Chromosome intra- and inter-exchanges determined by G-banding in radiation
workers with in vivo exposure to plutonium. J. Radiat. Prot., 25:83-88. |
| Observations: (1) The translocation frequencies were significantly higher than those of external dose controls and unexposed controls, indicating that the external gamma-rays have not been registered as chromosome aberrations. (2) No evidence of chromosomal instability or bystander effects: Chromosome aberration frequencies, in particular unstable-type aberrations and chromatid-type aberrations, were not affected by sampling time, indicating no evidence for chromosomal instability or bystander effects of plutonium exposure. (3) Breakpoints of exchange aberrations were randomly distributed over the chromosomes. |
| Study group | No. of | Mean age | Mean external | Mean internal RBM | No. of | Frequency per 1000 cell (95% CI) | |||
| subjects | years (range) | dose, mSv | dose, mSv | cells | Simple Translocations | Inv+Int del | Stable complexes | ||
| Plutonium workers | 20 | 56 (43-64) | 397 (39-819) | 169 (65-533) | 2,000 | 19.50 (13.87, 26.66) | 6.50 (3.46, 11.12) | 2.00 (0.55, 5.12) | |
| External dose controls | 20 | 56 (40-64) | 405 (38-804) | 7 (0-20) | 2,000 | 10.00 (6.11, 15.45) | 3.50 (1.41, 7.21) | 1.00 (0.12, 3.61) | |
| Unexposed controls | 20 | 56 (42-65) | 8 (0-28) | 0.1 (0-2) | 2,000 | 11.00 (6.90, 16.66) | 2.00 (0.55, 5.12) | 0.50 (0.01, 2.79) | |
| . | |||||||||
| Sellafield nuclear plant workers [4] (FISH analysis; Tawn et al. 2004, 2006) |
| Chromosome aberration analysis |
|
Chromosome aberration analysis was carried out by FISH method on the retired male workers (Ex-workers) from Sellafield nuclear processing facility. Chromosome aberrations in peripheral blood lymphocytes were carried out by FISH-painting technology using whole chromosome painting probes fro chromosomes 1, 3 and 4. [1] External exposure: In the first set of study (ref. 1), a total of 294 Ex-workers were categorized into 3 groups according to their lifetime occupational external doses as measured by film badge reading. They were a high-dose group with >500 mSv, an intermediate-dose group with 200-350 mSv and a control group with <50 mSv. In this study (i.e., examination of the effects of low-LET external occupational radiation exposure), any individuals with known histories of substantial intake of radionuclides or who had received radiotherapy were excluded. All samples were obtained between February 1997 and February 2000. [2] Pu internal exposure: In the second set of study (ref. 2), 46 retired plutonium workers (Pu Ex-workers) were selected from the male Ex-workers with assessed internal bone marrow doses over 60 mSv. The included 34 workers having robust RBM dosimetry and 12 workers whose internal doses were less reliable. For comparison, age-matched 34 workers with similar recorded external doses but negligible internal dose for externa dose controls, and 34 workers with negligible radiation exposure for unexposed controls. |
| Reference |
|
(1) Tawn, E. J., Whitehouse, C. A. and Tarone,
R. E. (2004): FISH chromosome aberration analysis on retired radiation
workers from the Sellafield nuclear facility. Radiat. Res., 162:249-256. |
| Observations |
| Study [1] Tawn et al. 2004 | |||||||||
| Occupational dose | No. of | Mean age | Mean external | No. of | FG (10-3) | ||||
| (mSv) | subjects | years (range) | dose, mSv | cells | Translocations | Simple dicentrics | Total dicentrics | Total complexes | |
| <50 | 95 | 69 (51-84) | 23 (0-50) | 32,775 | 11.56±0.84 | 0.67±0.17 | 1.68±0.28 | 1.59±0.22 | |
| 50-499 | 108 | 69 (54-87) | 261 (52-418) | 37,260 | 10.74±0.85 | 0.56±0.15 | 1.15±0.21 | 1.05±0.17 | |
| 500-999 | 82 | 70 (57-89) | 664 (500-986) | 28,290 | 19.58±1.14 | 1.59±0.30 | 2.69±0.39 | 1.98±0.26 | |
| &rt;1000 | 9 | 72 (64-78) | 1,287 (1,015-1,873) | 3,105 | 28.02±4.53 | 1.61±0.72 | 1.93±0.79 | 2.25±0.94 | |
| *) Number in parentheses shows insertions inclusive. | |||||||||
| . | |||||||||
| Study [2] Tawn et al. 2006 | |||||||||||||
| Occupational dose | No. of | Mean age | Mean external | Mean internal RBM | No. of | No. of chromosome aberrations | FG (10-3) | ||||||
| (mSv) | subjects | years (range) | dose, mSv | dose, mSv | cells | Translocations | Dicentrics | Stable complexes* | Translocations | Dicentrics | Stable complexes | Unstable complexes | Total complexes |
| Unexposed controls | 34 | 68 (52-81) | 20 (0-37) | 2 (0-20) | 11,730 | 118 | 6 | 5 (2) | 10.06±1.16 | 0.51±0.21 | 0.43±0.19 | 0.85±0.27 | 1.28±0.33 |
| External dose controls | 34 | 69 (53-82) | 555 (42-1,329) | 9 (0-40) | 11,730 | 159 | 16 | 9 (5) | 13.55±1.43 | 1.36±0.55 | 0.77±0.33 | 1.19±0.32 | 1.96±0.41 |
| Plutonium workers | 34 | 68 (52-82) | 556 (39-1,415) | 156 (61-538) | 11,730 | 207 | 11 | 14 (7) | 17.65±1.96 | 0.94±0.28 | 1.19±0.32 | 1.28±0.49 | 2.47±0.63 |
| (uncertain internal dosimetry) | 12 | 76 (66-89) | 326 (6-714) | 250 (70-520) | 4,140 | 50 | 1 | 1 (1) | 12.08±1.92 | 0.24±0.24 | 0.24±0.24 | 1.45±0.59 | 1.69±0.66 |
| *) Number in parentheses shows insertions inclusive. | |||||||||||||
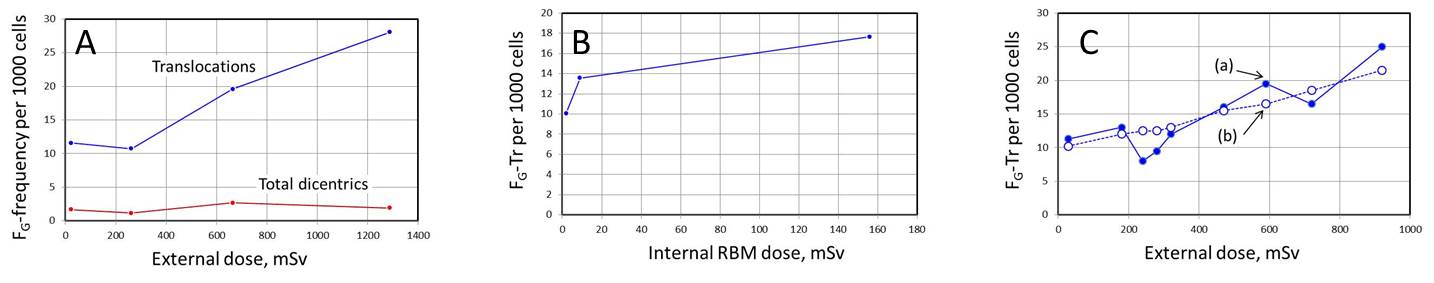
| Commentary: Low-dose enigma |
| The suppression of translocations at low dose level is apparent for external exposures to low-LET radiations (Fig. A) while such is not seen for plutonium exposure (Fig. B). Temporary depression of symmetric translocations was also seen when the authors tested for smaller subgroups (Fig. Ca). They argue that the translocation frequency could be dependent on accumulated dose which is also dependent on age, i.e., they are multivariate. Assuming a linear correlation, the authors adjusted the translocation frequency by covariate of age, and successfully erased the low-dose suppression coming to a linear regression (Fig. Cb). Such mathematical processing could be valid if the interrelations are both linearly related. This low dose enigma is also the case for low LET radiation exposure in Mayak industrial workers, Rocky Flats workers, radiological technicians, etc. The suppression of translocations at low dose level is apparent for external exposures to low-LET radiations (Fig. A) while such is not seen for plutonium exposure (Fig. B). Temporary depression of symmetric translocations was also seen when the authors tested for smaller subgroups (Fig. Ca). They argue that the translocation frequency could be dependent on accumulated dose which is also dependent on age, i.e., they are multivariate. Assuming a linear correlation, the authors adjusted the translocation frequency by covariate of age, and successfully erased the low-dose suppression coming to a linear regression (Fig. Cb). Such mathematical processing could be valid if the interrelations are both linearly related. This low dose enigma is also the case for low LET radiation exposure in Mayak industrial workers, Rocky Flats workers, radiological technicians, etc. |