| Fukushima fallout: Chromosome aberration analysis in field mice in Fukushima contaminated area |
| |
|
| Accident scenario and Contamination: see ¤Scenario |
|
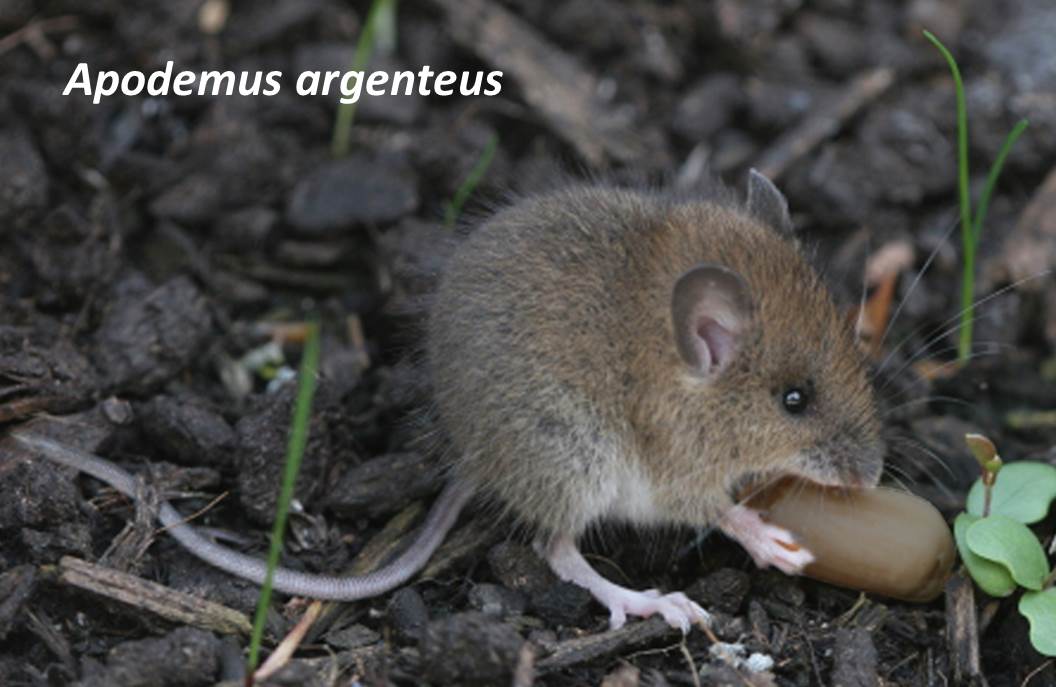
[1] Studies insmall Japanese field mice, Apodemus argenteus (Solid Giemsa/C-banding methods) |
|
Wild mice (Apodemus argenteus and Mus musculus) (image by Wikipedia 2015) living differently contaminated area by Fukushima
TEPCO nuclear power plant accident were captured and chromosome aberrations
were studied in cultured splenic lymphocytes. The mice were confirmed to
have been born well before the accident and dose due to the internal and
exposures were estimated by the activity concentration of 137Cs
and 134Cs in mice and measurement of ambient dose at the site of capture. |
|
Reference |
|
Kubota, Y., Tsuji, H., Kawagoshi, T., Shiomi, N., Takahashi, H., Watanabe, Y., Fuma, S., Doi, K., Kawaguchi, I., Aoki, M., Kubota, M., Furuhata, Y., higemura, Y., Mizoguchi, M., Yamada, F., Tomozawa, M., Sakamoto, D. H. and Yoshida, S. (2015): Chromosomal aberrations in wild mice captured a areas differently contaminated by the Fukushima Dai-ichi nuclear power plant. Environ. Sci. Technol., 49:10074-10083. |
| Sampling area | Location | Sampling | Ambient dosea | No. of | Activity at captureb, Bq/kg(wetmas) | Dose ratec (mGy/day) | Accumurated | No. of | Aberrationse | ||||||||||
| time | (μSv/h) | animals | 134Cs | 137Cs | Internal | External | dosed (mGy) | cells | cte | csb | Dic | R | F | Dmin | Others | ||||
| Non-contaminated | 93 km WNW to NPS | July 2013 | 0.1±0 | 6 | - | - | - | 0.002 | - | 11,764 | 11 | 4 | 6(2) | 1(0) | 22 | 9 | 9 | ||
| Slightly contaminated | 28 km S to NPS | July 2012 | 0.5±0.2 | 9 | 2,656 (988, 4,540) | 4,480 (1,866, 7,041) | 0.025(0.01, 0.04) | 0.01 | 8.83 | 19,952 | 14 | 3 | 9(4) | 0 | 38 | 18 | 3 | ||
| Moderately contaminated | 15 km NW to NPS | July 2012 | 30.9±5.4 | 9 | 33,450 (4,932, 77,136) | 51,052 (7,980, 12,3967) | 0.289 (0.078, 0.69) | 0.84 | 188.3 | 18,730 | 22 | 18 | 23(12) | 0 | 34 | 33 | 7 | ||
| Heavily contaminated area | 3.0 km W to NPS | July 2012 | 80.5±7.7 | 7 | 60,762 (4,080, 15,2545) | 90,652 (5,420, 229,084) | 0.481 (0.032, 1.3) | 2.2 | 749.4 | 14,955 | 10 | 18 | 27(14) | 0 | 50 | 37 | 11 | ||
| a) Measured values at 1m above ground at location of capture. | . | ||||||||||||||||||
| b) The activity concentration was measure at saclifice, and the activity was converted to those at the time of capture considering the time spent from capture and saclifice (rearing period) and biological half life of radionuclides. | |||||||||||||||||||
| The activity concentration is shown by an average (lowest, highest) values. | |||||||||||||||||||
| c) The external dose rate (D in mGy/day) was calculated based on the measured ambient dose rate (X in μSv/h) by D=(X)×1.138×24. | |||||||||||||||||||
| d) Accumurated dose: [Dose rate in mGy/day] multiplied by [estimated age in days] | |||||||||||||||||||
| e) Dic: dicentrics, R: centric rings (numbers in parentheses are those with associated fragments), F: acentric fragments, Dmin: minute dots (S), cte: chromatid exchanges, csb: isochromosome breaks, Others: marker chromosomes, deletions, translocations. | |||||||||||||||||||
| . | |||||||||||||||||||
| The reference dose-response relationships of dicentrics and total aberrations have been obtained for the splenic lymphocytes oflaboratory mice ,C3H/HeJ and Japanese field mice, after acute irradiation with X-rays. | |||||||||||||||||||
| For instance, the dose responses of dicentrics are Y=0.0634+0.003D for C3H mice and Y=0.0512+0.0022D for Japanese field mice (D in mGy). | |||||||||||||||||||
| For total aberrations, they are Y=0.4758+0.0062D and Y=0.5006+0.0081D, respectivly. | |||||||||||||||||||
| . | |||||||||||||||||||
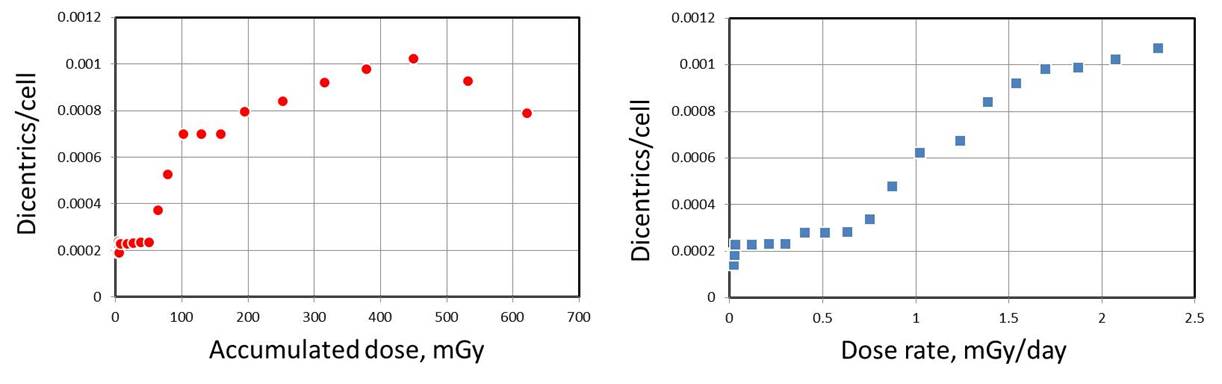
| Commentary to the dose-response relationships It is noticeable that there appears relatively large number of chromatid exchange aberrations and dicentrics without fragments. Therefore, at least some or most of the dicentrics without fragments are likely to be derived aberration arisen from chromatid exchanges aberrations. Even if the chromatid-type aberrations (induced in S/G2 of replication cycle) have any relevance to radiation, they may not be simply related to the dose-accumulation. When only dicentrics with associated fragments are considered, their frequencies are well correlated to the dose or dose-rate (right panel). Since doses within the exposed group vary condiderably among individuals, the response to dose and dose rate are smoothed by moving window averaging, MWA=5w1s, (right panels). (responses of dicentrics without fragments). Although the data are those of nonhuman biota, they are included here because they are very informative in considering the effects of radioactive fall-out on the residents. Please note that the commentary added during data compiling does not necessarily reflect the conclusion of authors. |
 |
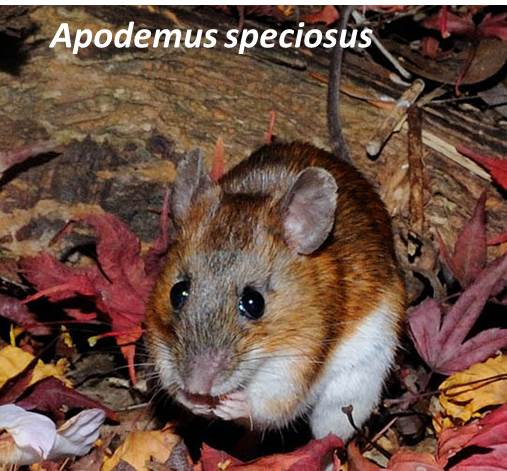
| [2] Studies in large Japanese field mice, Apodemus speciosus (FISH-painting method) |
|
Further to confirm the observations in small
Japanese field mice (Apodemus argenteus) and Mus
musculus (Kubota et al. 2015), the studies were extended to another field
mice, large Japanese field mice (Apodemus
speciosus) (image by Wikipedia 2015). In this species, C-banding method for identification
of centromeres was inefficient because the centromere region was stained
only poorly and hampered the identifications of precise location of centromere
in the rearranged chromosomes. Then, the authors made efforts newly develop
chromosome painting probes for FISH analysis. The probes obtained for chromosomes
1, 2 and 5 were applied to the A.
speciosus chromosomes. |
|
Reference: |
| Radiological data at the site of capture and accumulated dose to the mice. | ||||||
| Sampling area | Date of sampling | Ambient dose at the site | No. of mice | Dose rate | Accumulated dose | |
| (μSv/h)* | captured | Internal (mGy/day) | External (mGy/day) | assigned to the mice (mGy) | ||
| (1) Non-contaminated area | Jul-2013 | (0.1±0) | 7 | - | - | - |
| (2) Slightly contaminated area | Jul-2012-Oct-2014 | (0.3±0.1)-(0.4±0.2) | 9 | 0-0.036 | 0.008-0.011 | 1.26-13.49 |
| (3) Moderately contaminated area | Jul-2012-Oct-2014 | (7.5±30.-(30.7±7.4) | 10 | 0.01-0.245 | 0.205-0.838 | 26.73-439.89 |
| (4) Heavily contaminated area | Jul-2012 | (80.0±13.6) | 11 | 0.066-1.486 | 2.185 | 245.385-1386.63 |
| *) Dose rate at 1m above ground. | ||||||
|
Commentary: |
| |
|