Chernobyl fallout: Norwegian reindeer
Scenario

Chernobyl NPP accident resulted in a wide spread of considerable amounts of radioactive fallout in large areas of Europe. The fallout closely followed rainfall and was therefore heterogeneously distributed. Central Norway was one of the areas in Western Europe most highly contaminated by fallout deposition, while Northern Norway remained unaffected.

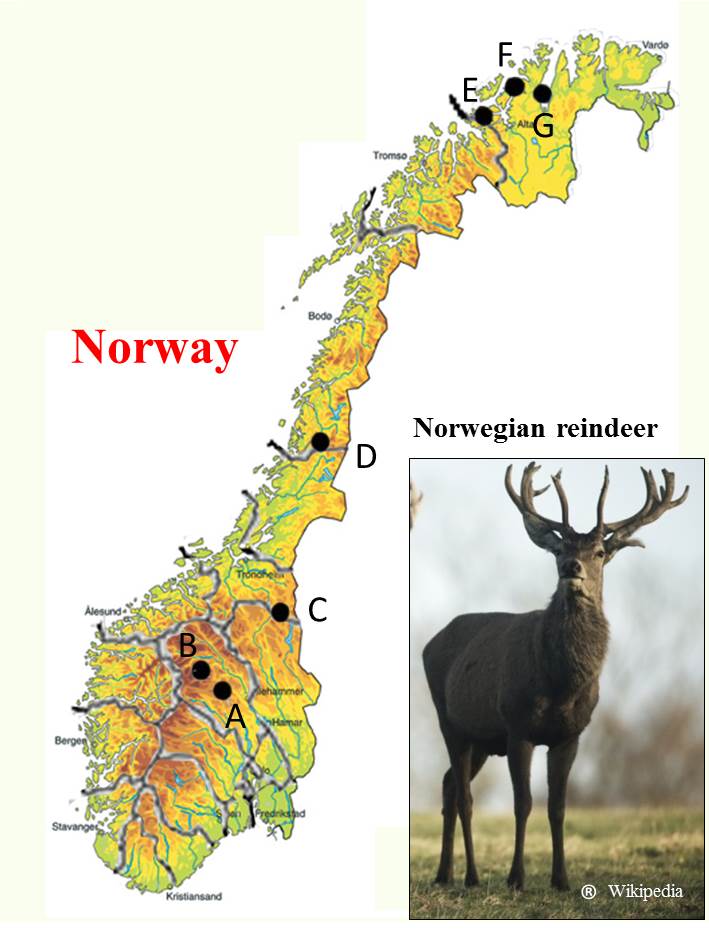
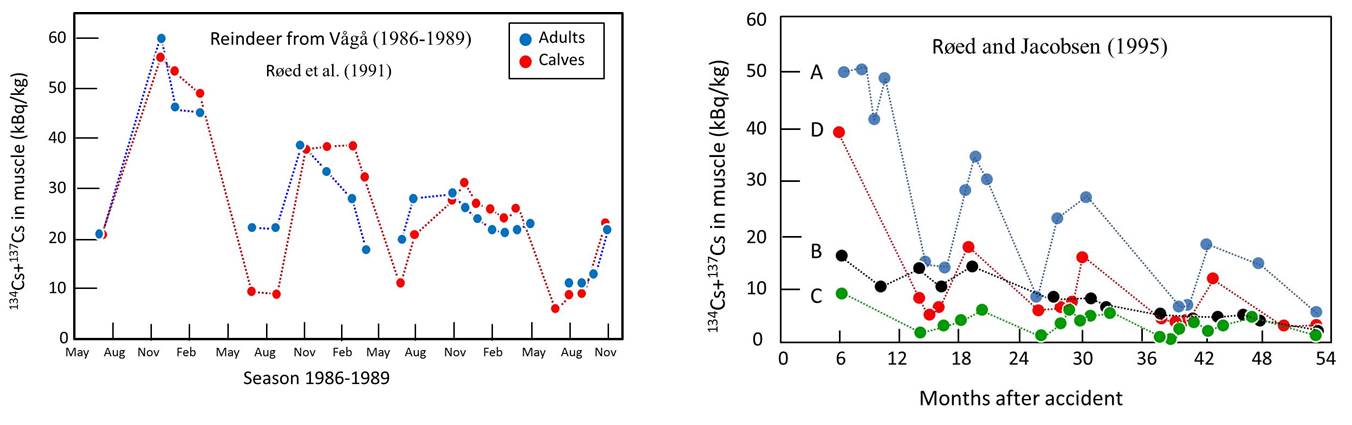
Chromosome aberrations in peripheral blood lymphocytes were studied in adult and calf reindeer, Rangifer tarandus L (image by Wikipedia 2015). The reindeer is particularly exposed to isotopes from radioactive fallout relying as it does on lichen as one of its main food resources. The lichen takes its nourishment from the air and may thus absorb all kinds of airborne particles and accumulate radioactive fallout. The levels of 134Cs+137Cs in individual reindeer in the most contaminated areas were recorded to be 150 kBq/kg. However, the level changes according to the seasons and time after the accident.

Samples for cytogenetic studies were taken at different times during the period from June 1987 to June 1990 as representatives of the exposed (Herd A, B, C and D) and non-exposed controls (Herd E, F and G).


134Cs+137Cs contamination levels in muscle of reindeer
 
Reference  

     Røed, K. H. and Jacobsen, M. (1995): Chromosome aberrations in Norwegian reindeer following Chernobyl accident. Mutation Res., 346:159-165.
     Røed, K. H., Eikelmann, I. M. H. and Jacobsen, M. (1991): Chromosome aberrations in Norwegian reindeer calves exposed to fallout from the Chernobyl accident. Hereditas, 115:201-206. 

Chromosome aberration analysis (Røed and Jacobsen 1995). Part of data were previously published by Røed et al (1991) 
.
. [1] Chromosome aberration analysis in 192 Norwegian reindeer (Røed and Jacobsen 1995)
Herd Area Blood sampling Area in No. of No. of Chromatid-type aberrations Chromosome-type aberrations
Røed et al. (1991) animals* cells per 100 cells (mean±SE)** per 100 cells (mean±SE)***
A Vågå July 1987-Sept 1990 Oppland, Vågå 79 4,212 8.15±0.68 0.55±0.13
B Lom July 1987 18 904 9.12±1.47 0.56±0.27
C Røros Dec 1989; Nov 1990 25 1,751 10.23±1.14 0.56±0.27
D Brurskanken Nov 1987; Sept 1988 27 1,404 5.30±0.80 0
E Seiland March 1988 Finnmark, III 14 732 9.85±1.38 0.43±0.43
F Frakfjord July 1988 Finnmark, II 17 950 3.94±0.96 0.24±0.16
G Vuorjenjarg Nov 1988 Finnmark, I 12 700 14.33±2.31 0
*) Out of a total of 192 animals, 50 have been previously reported in paper by Røed et al. (1991).
**) Chromatid-type aberrations include chromatid gaps, breaks, isogaps and isobreaks.
***) Chromosome-type aberrations include teo-break events such as dicentrics, rings and translocations
.
.
. [2] Chromosome aberrations in adults (age >1 year) vs calves (age <1 year) in the exposed and non-exposed
Exposure Age class No. of No. of Chromatid-type aberrations Chromosome-type aberrations
animals cells per 100 cells (mean±SE) per 100 cells (mean±SE)
Exposed Adults 89 4,714 8.80±0.66 0.44±0.09
Calves 60 3,530 7.06±0.67 0.42±0.16
Total 149 8,271 8.10±0.48 0.43±0.08
Non-exposed Adults 17 850 10.00±1.76 0.47±0.36
Calves 26 1,532 7.96±1.36 0.07±0.07
Total 43 2,382 8.77±1.07 0.23±0.15
.
.
. [3] Chromosome aberrations in age classes of reindeer from the Vågå area (A)
Age class No. of No. of Chromatid-type aberrations Chromosome-type aberrations
animals cells per 100 cells (mean±SE) per 100 cells (mean±SE)
Born before 1986 18 910 7.67±1.69 0.44±0.20
Born in 1986 18 958 9.64±1.33 0.60±0.21
Born after 19876 28 1,422 7.23±1.01 0.64±0.29
.