| Chernobyl fallout: Norwegial populations |
|
Scenario |
|
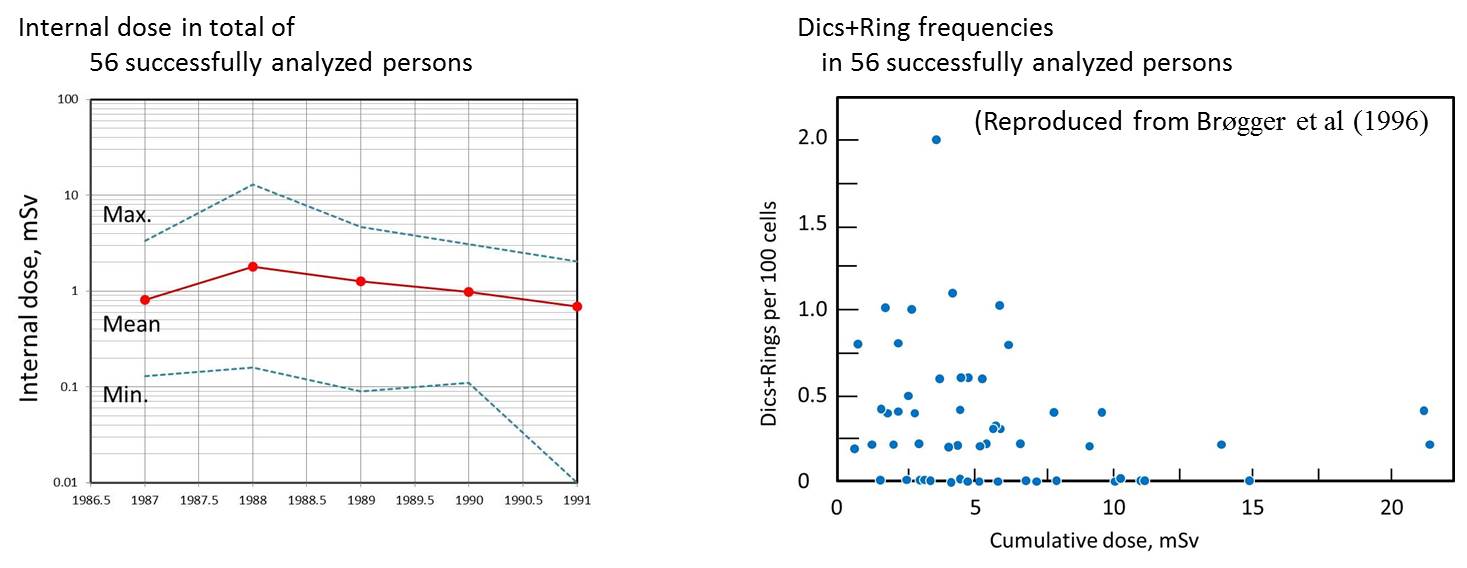
After Chernobyl accident in 1986, fairly
high levels of radioactive contamination occurred in parts of Norway in
spots up to 600 kBq/m2. However, the dose to Norwegian population have been small, except for
some rural populations living of reindeer breeding and mountain sheep production.
Chromosome aberration frequencies were compared with those of historical laboratory data on non-exposed persons. The aberration frequencies were within the normal range except for that of dicentrics and rings, which was 10-fold increase in the exposed. |
|
Reference |
|
Brogger, A., Reitan, J. B.. Strand, P. and Amundsen, I. (1996): Chromosome analysis of peripheral lymphocytes from persons exposed to radioactive fallout in Norway from the Chernobyl accident. Mutation Res., 361:73-79. |
| Chromosome aberration analysis |
| . | ||||||||||||||||||||||
| Internal dose | No. of persons | No. of | Chromosome aberrations | |||||||||||||||||||
| Inhavitants | (mSv/year) | sucsessfully | cells | ctg | csg | ctb | csb | cte | ace | dic | ring | |||||||||||
| 1991 | 1986-1991 | examined | examined | mean | SD | mean | SD | mean | SD | mean | SD | mean | SD | mean | SD | mean | SD | mean | SD | |||
| Roros/Snasa | 0.71 | 1.08 | 44/56 | 17,682 | 0.5 | 0.5 | 0.2 | 0.3 | 0.6 | 0.5 | 0.02 | 0.07 | 0.04 | 0.1 | 0.5 | 0.6 | 0.3 | 0.4 | 0.07 | 0.1 | ||
| Oystre slide | 0.54 | 0.83 | 12/18 | 4,747 | 0.8 | 0.7 | 0.5 | 0.4 | 1.2 | 0.6 | 0.02 | 0.06 | 0.02 | 0.06 | 0.7 | 0.7 | 0.2 | 0.3 | 0.05 | 0.09 | ||
| Total | 56/74 | 22,429 | 0.6 | 0.5 | 0.2 | 0.3 | 0.7 | 0.6 | 0.02 | 0.07 | 0.04 | 0.09 | 0.5 | 0.6 | 0.3 | 0.4 | 0.07 | 0.1 | ||||
| . | ||||||||||||||||||||||