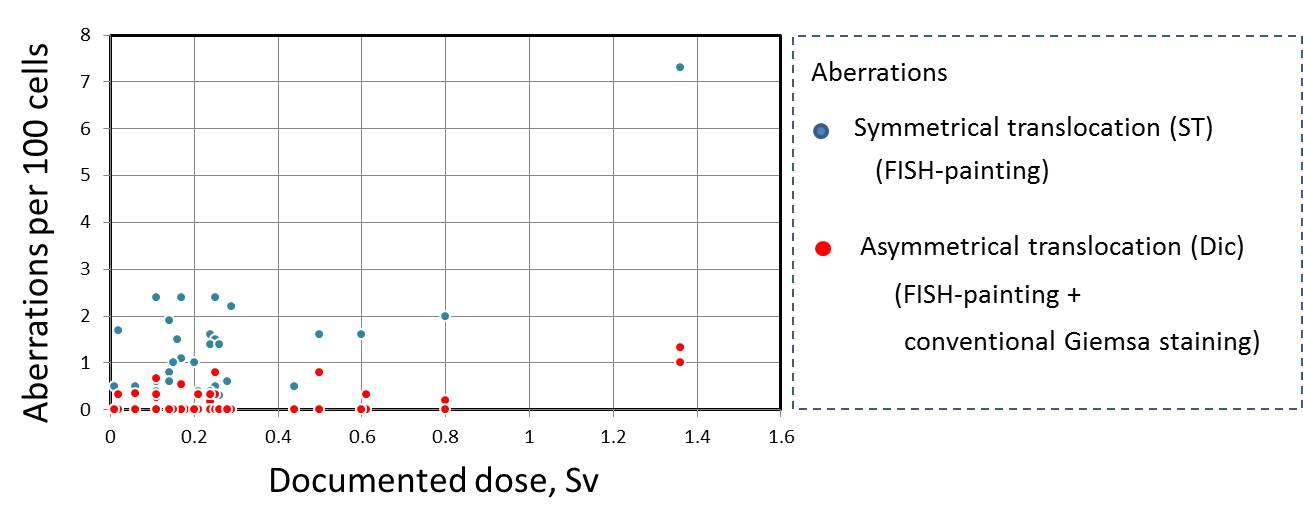
| Subject | Age at blood | Doccumented | FISH painting** | Cinventional Giemsa | |||
| ID | sampling | dose* | No. of | FG | No. of | Dics | |
| (year) | (Sv) | cells | ST/100 cells | Dics/100 cells | cells | (per 100 cells | |
| 1 | 33 | 0.26 | 396 | 0 | 0 | 300 | 0 |
| 2 | 48 | 0.25 | 673 | 0.5 | 0 | 300 | 0 |
| 3 | 30 | 0.06 | 1,279 | 0.5 | 0 | 300 | 0.35 |
| 4 | 37 | 0.21 | 849 | 0.4 | 0 | 300 | 0.33 |
| 6 | 39 | 0.26 | 970 | 0.3 | 0 | 300 | 0 |
| 7 | 31 | 0.21 | 415 | 0 | 0 | 300 | 0 |
| 8 | 28 | 0.18 | 525 | 0 | 0 | 300 | 0 |
| 9 | 43 | 0.24 | 1,700 | 0.4 | 0.18 | 300 | 0.33 |
| 10 | 43 | 0.16 | 425 | 1.5 | 0 | 300 | 0 |
| 11 | 63 | 0.27 | 618 | 0 | 0 | 300 | 0 |
| 12 | 35 | 0.24 | 393 | 1.6 | 0 | 300 | 0 |
| 13 | 39 | 0.2 | 928 | 1 | 0 | 300 | 0 |
| 14 | 37 | 0.14 | 1,600 | 0.8 | 0 | 300 | 0 |
| 15 | 31 | 0.44 | 595 | 0.5 | 0 | 300 | 0 |
| 16 | 47 | 0.11 | 790 | 0.4 | 0 | 300 | 0.33 |
| 17 | 30 | 0.14 | 1,297 | 1.9 | 0 | 300 | 0 |
| 18 | 34 | 0.25 | 408 | 1.5 | 0 | 300 | 0.33 |
| 19 | 58 | 0.02 | 570 | 1.7 | 0 | 300 | 0.33 |
| 20 | 49 | 0.17 | 1,314 | 2.4 | 0 | 300 | 0 |
| 21 | 31 | 0.17 | 578 | 1.1 | 0.54 | 300 | 0 |
| 22 | 33 | 0.15 | 958 | 1 | 0 | 300 | 0 |
| 23 | 43 | 0.29 | 857 | 2.2 | 0 | 300 | 0 |
| 24 | 62 | 0.14 | 1,056 | 0.6 | 0 | 300 | 0 |
| 25 | 35 | 0.11 | 1,161 | 2.4 | 0.27 | 300 | 0.67 |
| 26 | 56 | 0.24 | 460 | 1.4 | 0 | 300 | 0.33 |
| 27 | 72 | 0.8 | 1,688 | 2 | 0.19 | 300 | 0 |
| 28 | 56 | 0.25 | 395 | 2.4 | 0.8 | 300 | 0 |
| 29 | 36 | 0.01 | 600 | 0.5 | 0 | 300 | 0 |
| 30 | 49 | 0.5 | 797 | 1.6 | 0.79 | 300 | 0 |
| 31 | 45 | 1.36 | 473 | 7.3 | 1.33 | 300 | 1 |
| 32 | 37 | 0.61 | 930 | 0.3 | 0 | 300 | 0.33 |
| 33 | 57 | 0.6 | 1,157 | 1.6 | 0 | 300 | 0 |
| 34 | 47 | 0.26 | 1,097 | 1.4 | 0 | 300 | 0 |
| 35 | 55 | 0.28 | 527 | 0.6 | 0 | 300 | 0 |
| 36 | 64 | 0.11 | 1,135 | 0.6 | 0 | 300 | 0 |
| 37 | 36 | 9999 | 468 | 0.7 | 0 | 300 | 0.33 |
| 38 | 46 | 9999 | 703 | 0.9 | 0.45 | 300 | 0.33 |
| 39 | 28 | 9999 | 1,304 | 0.2 | 0.24 | 300 | 0 |
| 40 | 35 | 9999 | 506 | 0.6 | 0 | 300 | 0 |
| 41 | 48 | 9999 | 756 | 1.2 | 0 | 300 | 0.67 |
| 42 | 32 | 9999 | 967 | 0 | 0 | 300 | 0 |
| 43 | 46 | 9999 | 1,407 | 0 | 0 | 300 | 0 |
| 44 | 53 | 9999 | 678 | 0.9 | 0 | 300 | 0 |
| 45 | 37 | 9999 | 410 | 2.3 | 0 | 300 | 0 |
| 46 | 65 | 9999 | 1,459 | 1.5 | 0.22 | 300 | 0.33 |
| 47 | 59 | 9999 | 859 | 1.8 | 0 | 300 | 0 |
| 48 | 34 | 9999 | 720 | 0.9 | 0 | 300 | 0.33 |
| 49 | 29 | 9999 | 1,196 | 0 | 0 | 300 | 0 |
| 50 | 38 | 9999 | 428 | 0.7 | 0 | 300 | 0 |
| 51 | 52 | 9999 | 583 | 3.2 | 1.08 | 300 | 0 |
| 52 | 72 | 9999 | 1,209 | 1.8 | 0.26 | 300 | 0 |
| 53 | 54 | 9999 | 1,016 | 4.6 | 0 | 300 | 0.8 |
| *) Dose=9999 means that the documented dose is unknown. | |||||||
| **) FG: Genome equivalent translocations. ST: Symmetrical translocations. Dic: Dicentrics | |||||||