| Chernobyl: Cleanup workers (Russia), Slozina et al. 2001; Neronova et al. 2003 |
| Scenario |
|
The All-Russia Center of Emergency and Radiation Medicine EMERCOM of Russia (ARCERM) started clinical examinations of Chernobyl cleanup workers at 1992. Cytogenetic examinations have been carried out simultaneously with clinical investigations as a part of the program. A total of 392 cleanup workers and 50 control persons were investigated cytogenetically in 1992-2000. For those workers, the cleanup activities were performed in 1986-1900. The stay at Chernobyl was from 1 week to several months for 283 of 392 workers. Most of them received up to 25 cGy of external radiation, but 30 persons received from 25.1 cGy to 1 Gy. Therefore, the mean dose was 20.2±0.10 cGy for cleanu@ workers who worked at the station in 1986, 13.4±1.70 cGy for those who were there in 1987, and 5.2±0.9 cGy for those who worked at the station in 1988-1990. The control group was the same age and health status as the cleanup workers. |
|
Reference |
|
[1] Neronova, E., Slozina, N. and Nikiforov, A.
(2003): Chromosome aberrations in cleanup workers sampled years after the
Chernobyl accident. Radiat. Res., 160:46-51. |
|
Chromosome aberration analysis (Ref. 1) |
| . | ||||||||
| Years of working | No. of | No. of | Chromosome aberrstions (number and mean freuency per 100 cells ± SE)** | |||||
| at the station* | persons | cells | Chromatic breaks | Chromatid exchages | Acentric fragments | Dicentrics+rings | ||
| 1986 (8, 6-13) | 279 | 47,533 | 853 (1.80±0.11) | 66 (0.14±0.02)b | 381 (0.80±0.05)c | 153 (0.32±0.03)c | ||
| 1987 (7, 5-12) | 76 | 10,476 | 127 (1.21±0.16) | 9 (0.09±0.03)a | 87 (0.83±0.15)b | 22 (0.21±0.05)a | ||
| 1988-90 (6, 4-11) | 37 | 5,528 | 129 (2.33±0.37) | 14 (0.25±0.07)c | 62 (1.12±0.20)c | 18 (0.33±0.08)b | ||
| Workers total | 392 | 63,537 | 1,109 (1.73±0.02) | 89 (0.14±0.003)a | 530 (0.84±0.007)c | 193 (0.30±0.003)c | ||
| Controls | 50 | 8,724 | 108 (1.24±0.18) | 0 (0±0.02) | 23 (0.26±0.06) | 3 (0.03±0.02) | ||
| *) Modal number of years fromexposure to analysis and range. | . | |||||||
| **) Significance levels: significantly different from controls at (a) 0.05 level, (b) 0.01 level, (c) 0.001 level. | . | |||||||
| Chromosome aberration analysis (Ref. 2) |
| Time after accident | No. of | No. of | No. of aberrations | |
| (years) | subjects | cells | dics | rings |
| 6 | 14 | 1,573 | 2 | 0 |
| 8 | 100 | 10,180 | 24 | 1 |
| 9 | 63 | 11,869 | 22 | 7 |
| 10 | 35 | 5,821 | 22 | 4 |
| 11 | 12 | 2,125 | 9 | 1 |
| 12 | 19 | 3,711 | 11 | 3 |
| Control | 48 | 7,175 | 3 | 0 |
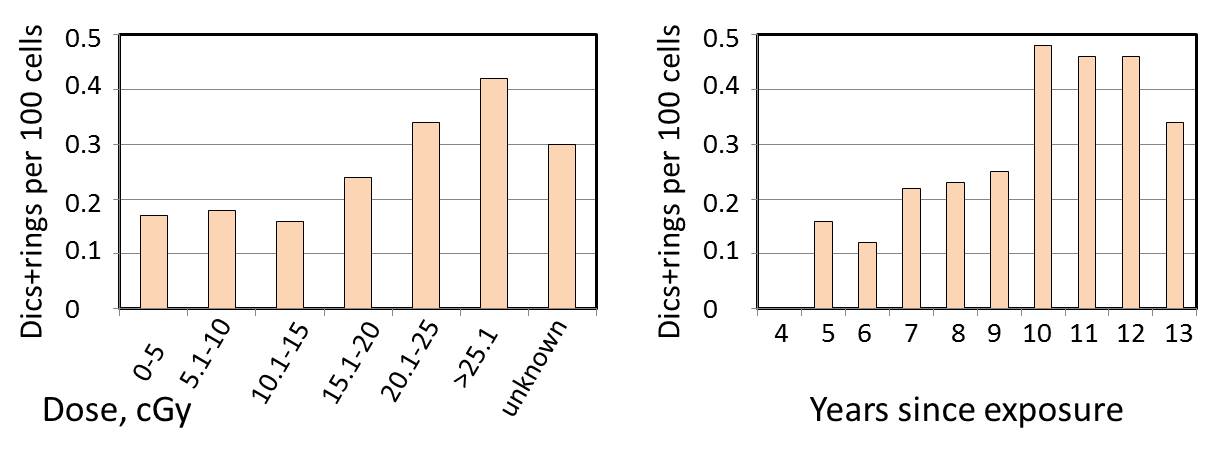
Following Figure was partially reproduced from Fig. 1 of Slozina et al. 2001. It is noted that the time-dependent increase of unstable aberrations. This contrasts to the time-dependent decrease of unstable aberrations in cleanup workers in Kharkov.
In this figure, (a): This paper (Slozina et al. 2001). (b): Komar et al.
1997 (cited from Slozina et al. 2001) and (c) Shevchenko et al., Radiat.
Biol., Radiat. Ecol., 35:646-64, 1995.
.jpg)