Bikini incident: Fallout radiation from thermonuclear explosion at Bikini (T. Ishihara & T. Kumatori) |
Scenario
On 1 March 1954, a thermonuclear test
explosion, called ‘Castle Bravo’ test, was performed by U.S. authority
at Bikini atoll in North Pacific Orcean. The explosion resulted in large
amount of radioactive fallout. In contrast to the predicted wind direction,
the fallout spread out to the northeast direction and resulted in moderate
to high level of radiation exposures to large number of people including
the native Marshallese (some 240 Marshallese living on Rongelap-, Sifo-,
Ailinginae- and Utrik-atolls) and 28 American military men on Rongerik-atoll.
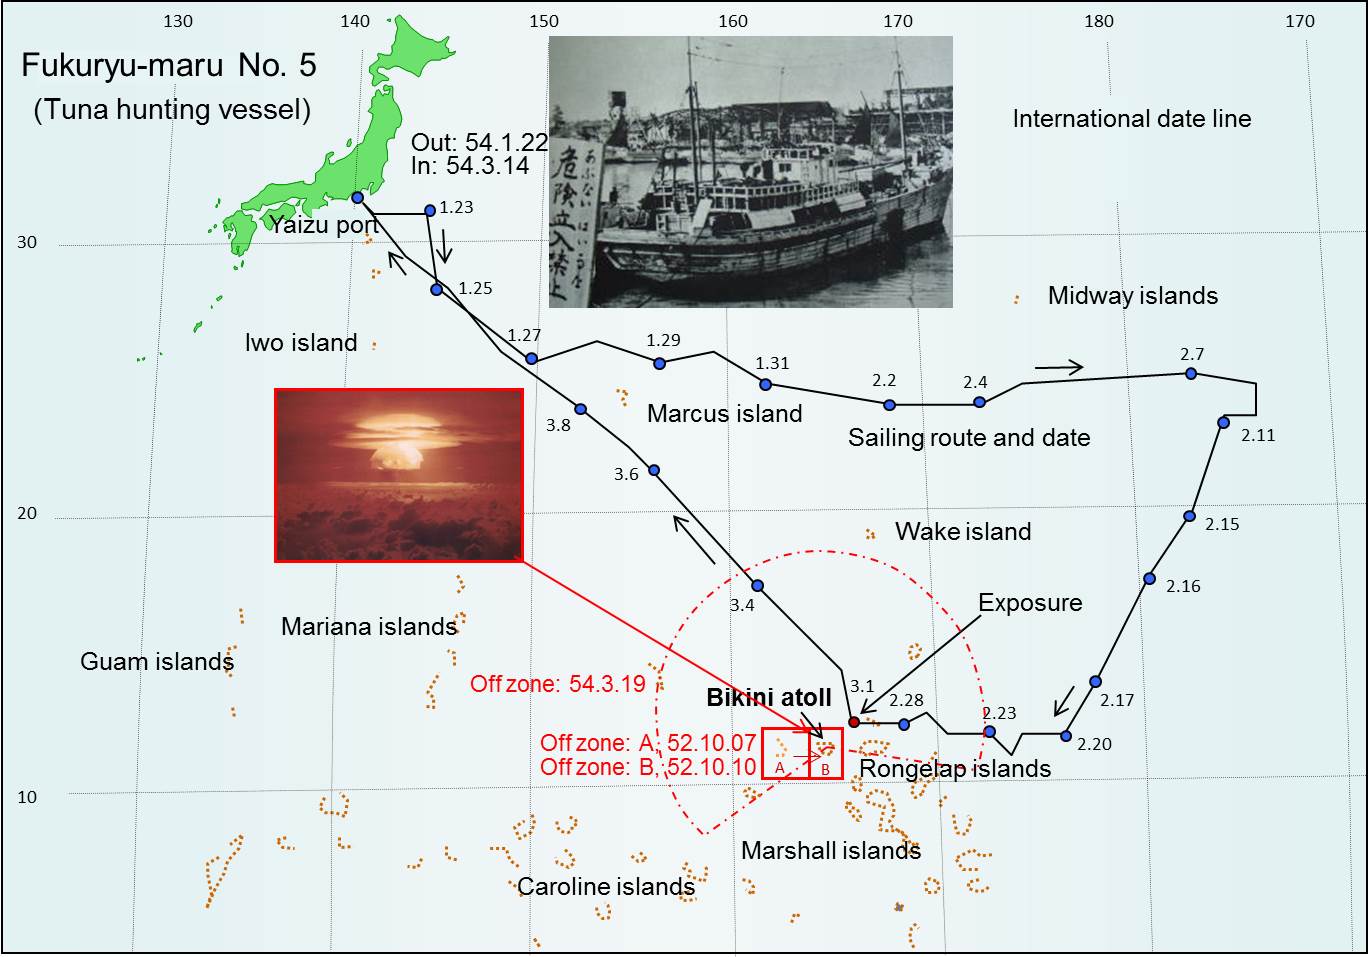
Dose reconstruction: |
![]() |
Chromosome aberration analysis |
It should be noted that the lymphocyte culture
technique became available in 1960 (Moorhead et al., Exp. Cell Res., 20:613,
1960). In the early stages of human radiation cytogenetics, in particular
before 1969 (e.g., 1969 report of UNSCEAR), the lymphocyte culture method
for quantitative analysis of radiation-induced chromosome aberrations has
not been established; for instance the chromosome aberration analysis has
been made by 72-h culture, which eliminates significant number of unstable
aberration by cell division in culture. In the Bikini cases, standardized
conventional 2-day cultures have been applied for the blood samples taken
13-28 year after exposure. |
References |
Ishihara, T. and Kumatori, T. (1967): Chromosome studies on Japanese exposed
to radiation resulting from nuclear explosion. In: Evans, H. J., Court
Brown, W. M. and Mclean, A. S. eds., ‘Human Radiation Cytogenetics’. North-Holland
Publ. Co., Amsterdam. pp.144-166. |
Chromosome aberrations in peripheral blood lymphocytes and bone marrow cells |
(1) Chromosome aberrations in lymphocytes of 1964 samples (72-h cultures) | (2) Chromosome aberrations in lymphocytes of 1965 samples (72-h cultures) | ||||||||||||||||||
Subject | Age | External dose | No. of | <2n cells | Cu-cells | Cs-cells | No. of aberrations | No. of | <2n cells | Cu-cells | Cs-cells | No. of aberrations | |||||||
(Gy) | cells | (%) | (%) | (%) | Dic | Ring | Ace | Others* | cells | (%) | (%) | (%) | Dic | Ring | Ace | Others* | |||
B-1 | 33 | 4.2 | 200 | 2 | 0.5 | 1 | 1 | 200 | 3 | 1 | 1 | 1 | 1 | ||||||
B-2 | 39 | 3.1 | 200 | 2.5 | 0.5 | 0.5 | 1 | 200 | 2 | 1 | 1.5 | 1 | 1 | ||||||
B-3 | 32 | 2.7 | 200 | 3.5 | 0.5 | 2 | 1 | 200 | 3 | 0.5 | 1.5 | 1 | |||||||
B-4 | 34 | 2.4 | 200 | 4.5 | 0.5 | 1.5 | 1 | 200 | 3 | 0 | 1.5 | ||||||||
B-5 | 35 | 2.5 | 200 | 6 | 0 | 0.5 | 200 | 2 | 0 | 2 | |||||||||
B-6 | 34 | 2.8 | 200 | 4.5 | 0.5 | 1.5 | 1 | 200 | 5.5 | 0 | 1 | ||||||||
B-7 | 33 | 2.2 | 200 | 3 | 0 | 1 | 200 | 3 | 0 | 1 | |||||||||
B-8 | 36 | 3.5 | 200 | 3.5 | 0.5 | 2 | 1 | ||||||||||||
B-9 | 32 | 6.6 | 200 | 3 | 0.5 | 1.5 | 200 | 4.5 | 1 | 3 | 2 | 1 | |||||||
B-10 | 36 | 5.7 | 100 | 2 | 0 | 2 | |||||||||||||
B-11 | 28 | 2.2 | 200 | 2 | 0 | 0.5 | 200 | 2 | 0 | 0.5 | |||||||||
B-12 | 30 | 2.4 | 200 | 2 | 1 | 2 | 2 | 200 | 2 | 0.5 | 1.5 | 1 | 2 | ||||||
B-13 | 32 | 3.4 | 200 | 3 | 0.5 | 0.5 | 1 | ||||||||||||
B-14 | 37 | 2.6 | 200 | 2.5 | 0 | 0.5 | |||||||||||||
B-15 | 34 | 4.3 | 200 | 2.5 | 0 | 1 | |||||||||||||
B-16 | 33 | 2.4 | 200 | 3.5 | 0.5 | 1 | 1 | ||||||||||||
Controls (20 healthy persons) | 2,874 | 2.09 | |||||||||||||||||
*) multiple aberrations |
(3) Chromosome aberrations in peripheral blood lymphocytes (2-day culture) | (4) Chromosome aberrations in bone marrow cells | ||||||||||
Years after | No. of | No. of | Aberrations (%) | Years after | No. of | No. of | No. of Cs+ | ||||
exposure | cases | cells | Dic+ring | Frag | Cs-cells | <2n cells | exposure | cases | cells | <2n cells | |
13 | 9 | 725 | 0.83 | 0.41 | 2.34 | 0.14 | 13 | 8 | 562 | 18 | |
14 | 9 | 820 | 19 | ||||||||
15 | 8 | 2,912 | 0.52 | 0.36 | 2.1 | 0.16 | 15 | 8 | 700 | 19 | |
20 | 6 | 6,000 | 0.2 | 0.42 | 20-21 | 7 | 420 | 8 | |||
973 | 2.77 | 0.41 | |||||||||
24-25 | 10 | 15,000 | 0.31 | 0.31 | 24-25 | 10 | 900 | 15 | |||
2,000 | 0.3 | 3.15 | 0.4 | ||||||||
27-28 | 9 | 9,000 | 0.3 | 27-28 | 9 | 716 | 18 | ||||
900 | 4.44 | 0.66 |
(5) Dose estimation by Qdr and Cs methods in three groups of fishermen classified according to their minimum neutrophil caounts | ||||
Group | Minimum | Physically estimated | Chromosomally estimated dose (Gy)** by: | |
neutrophil count* | external dose | Qdr | Cs | |
I | 750 | 3.6-6.6 | 3.30 (1.95-4.20) | 1.90 (1.80-2.00) |
2.40 (1.20-3.30) | 2.23 (2.15-2.49) | |||
II | 751-1499 | 2.0-3.7 | 1.95 (0.36-3.30) | 1.30 (1.12-1.49) |
0.88 (0.20-1.75) | 1.40 (1.16-1.60) | |||
III | 1500 | 1.7-2.3 | 0.23 (0-1.00) | 1.10 (0.90-1.20) |
0.50 (0.10-1.50) | 1.09 (0.82-1.35) | |||
*) Minimum neutrophil counts: The neutrophil counts decreased with time after exposure, reached to the minimum counts | ||||
at 4-8 weeks, and then increased with further increase of time. | ||||
**) Chromosomally estimated dose with upper and lour bounds based on the 95% confidence limits of regression curves |
Bikini incident: 60 years after (Tanaka et al. 2016) |
Scenario |
In addition to the Fukuryu-maru No. 5 vessel,
other tuna hunting vessels were working in the vicinity (420-1200 km) of
the test site and exposed to the fallout of varying degrees. In this study,
lymphocyte chromosome aberrations were examined in 17 crew members from
8 fishing boats and 2 from one cargo ship. They include fishing boats Junko-maru
No. 8, Kaifuku-maru No. 5, Kosei-maru No. 2, Myoga-maru No. 5, Konpira-maru
No. 1, Housei-maru No. 10, Dai-maru No. 7 and Myojin-maru No. 2, and a
cargo ship Yaiko-maru. They are reportedly contaminated with fallout radiation
at a level of almost 4000 cpm at the time of their return to harbor in
Japan (Muroto, Kochi Prefecture). |
References |
Tanaka, K., Ohtaki, M. and Hoshi, M. (2016): Chromosome aberrations in Japanese fishermen exposed to fallout radiation 420-1200 km distant from the nuclear explosion test site at Bikini Atoll: report 60 years after the incident. Radiat. Environ. Biophys., 55:329-337. |
Chromosome aberration analysis |
. | Unstable-type aberrations | ||||||||
Group | No. of | Age | No. of cellls | Chromosome aberrations (number and frequency in 100 cells) | No. of X1Cu cells (number and %) | ||||
subjects | (yrs) | observed | Dic | Dic+cR | |||||
Controls | 9 | 75-84 | 12,539 | 14 (0.11±0.10) | 18 (0.15±0.16) | 10 (0.08±0.13) | |||
Exposed | 19 | 76-90 | 27,253 | 63 (0.26±0.20)* | 88 (0.35±0.20)* | 37 (0.17±0.06) | |||
*) Statistically significantly at p=0.01. | |||||||||
. |
. | Stable-type aberrations | ||||||
Group | No. of | No. of cellls | Cells with stable-type | No. of stable-type | No. of abnormal chromosomes | ||
subjects | observed | aberrations (%) | aberrations | per abnormal cells | |||
Controls | 9 | 2,768 | 68 (2.45±0.51) | 72 | 1.05±0.07 | ||
Exposed | 19 | 5,909 | 198 (3.35±0.77) | 238 | 1.15±0.20 | ||
Among 19 exposed person, 3 had chromosomally abnormal clones, 46,XY,t(2;9), 46,XY,t(2;3) and 47,XY,+mar, respectively. | |||||||
. |