| Thorotrast patients: Biodosimetry |
Thorotrast patients: Summary of the table
| Frequencyis of dicentrics (per cell) | No. of | No. of | Aberrations | Distribution of cells with indicated number of dicentrics | |||||||||||||||||||||
| Group | Range | Mean | subjects | cells | Cu | Cs | Tet | Tri | Dic | Rc | Ra | aM | F | del | S | del | Aberr | 0 | 1 | 2 | 3 | 4 | 5 | 6 | 7 |
| I | 0≤μ<0.025 | 0.0098 | 21 | 5,103 | 85 | 31 | 0 | 1 | 48 | 16 | 11 | 41 | 81 | 25 | 29 | 26 | Dics | 5,062 | 35 | 4 | 1 | 1 | - | - | - |
| II | 0.025≤μ<0.05 | 0.0345 | 23 | 6,979 | 273 | 86 | 0 | 10 | 221 | 54 | 34 | 132 | 314 | 57 | 77 | 61 | Dics | 6,802 | 127 | 38 | 10 | 2 | - | - | - |
| III | 0.05≤μ<0.1 | 0.0800 | 13 | 4,311 | 316 | 62 | 3 | 12 | 326 | 51 | 25 | 127 | 401 | 52 | 140 | 90 | Dics | 4,084 | 144 | 54 | 27 | 4 | 1 | - | - |
| IV | 0.1≤μ<0.2 | 0.1289 | 15 | 6,286 | 749 | 140 | 2 | 38 | 728 | 147 | 65 | 278 | 983 | 151 | 302 | 210 | Dics | 5,742 | 355 | 131 | 43 | 12 | 2 | 1 | - |
| V | 0.2≤μ | 0.2657 | 5 | 1,750 | 358 | 58 | 2 | 22 | 415 | 65 | 33 | 147 | 558 | 60 | 120 | 98 | Dics | 1,465 | 178 | 64 | 25 | 10 | 5 | 2 | 1 |
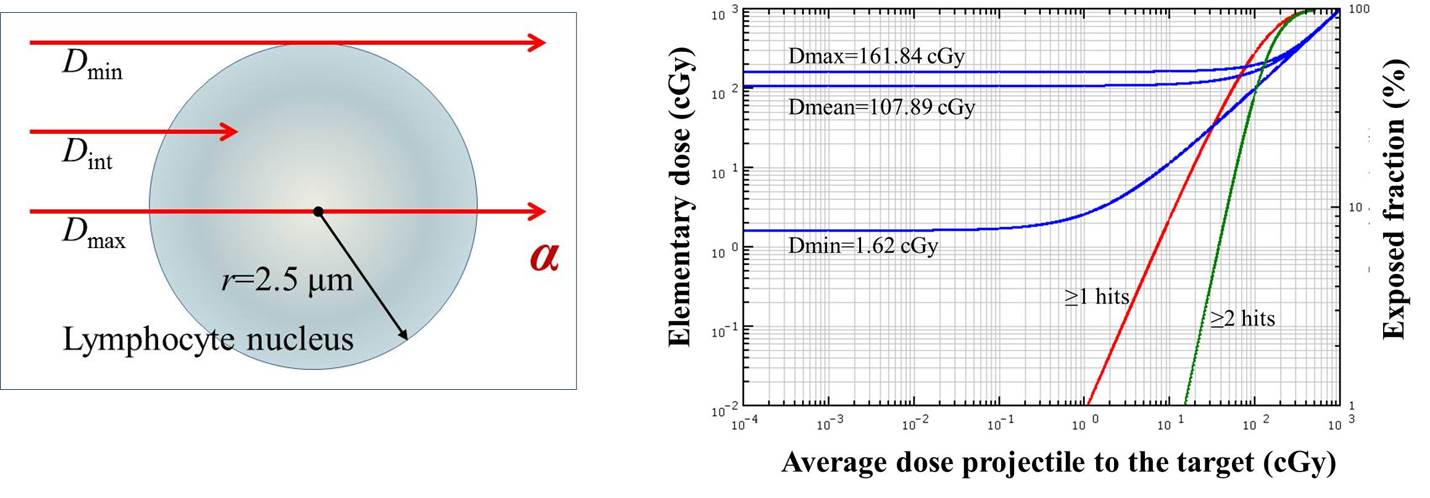
Dose to lymphocyte nucleus by traversal of 5 MeV alpha particles (track
average LET of 132.24 keV/micrometer in ICRU muscle equivalent material)
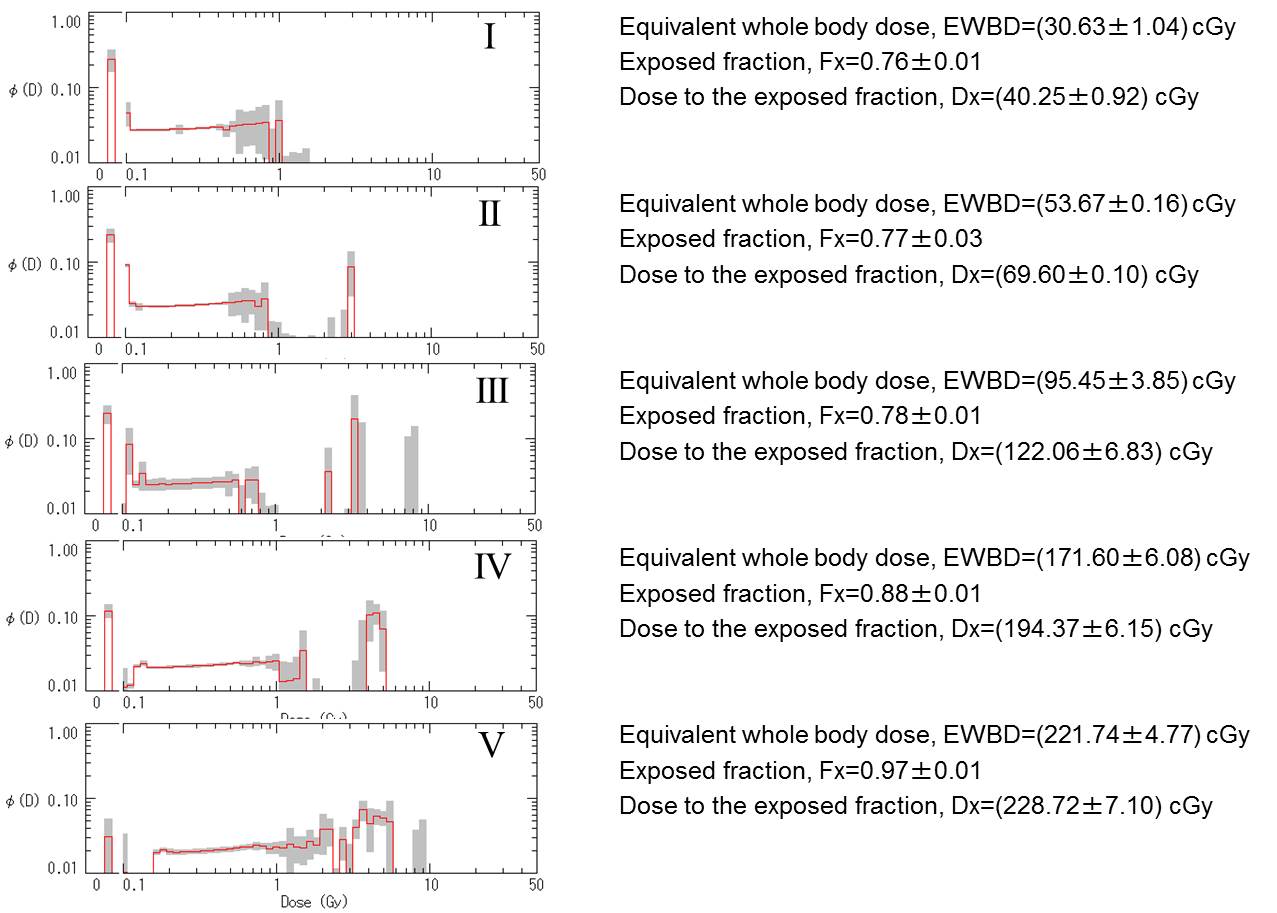
Biological dosimetry: Assessment of dose distribution profile by unfolding
distribution of dicentrics (Method: Sasaki, M. S., Int. J. Radiat. Biol.,
79:83-97, 2003)
(The dose profiles were those adjusted by lymphocyte survival, Do=3Gy,
after Edwards et al., Int. J. Radiat. Biol., 38:83-91, 1980.)